Overview - Database Connections
The Database Connections Overview shows how many connections your monitored instances receive and when they peak. Use it to find the busiest hours of the week and the instances that carry the most connections, then open an instance for the detail behind it.
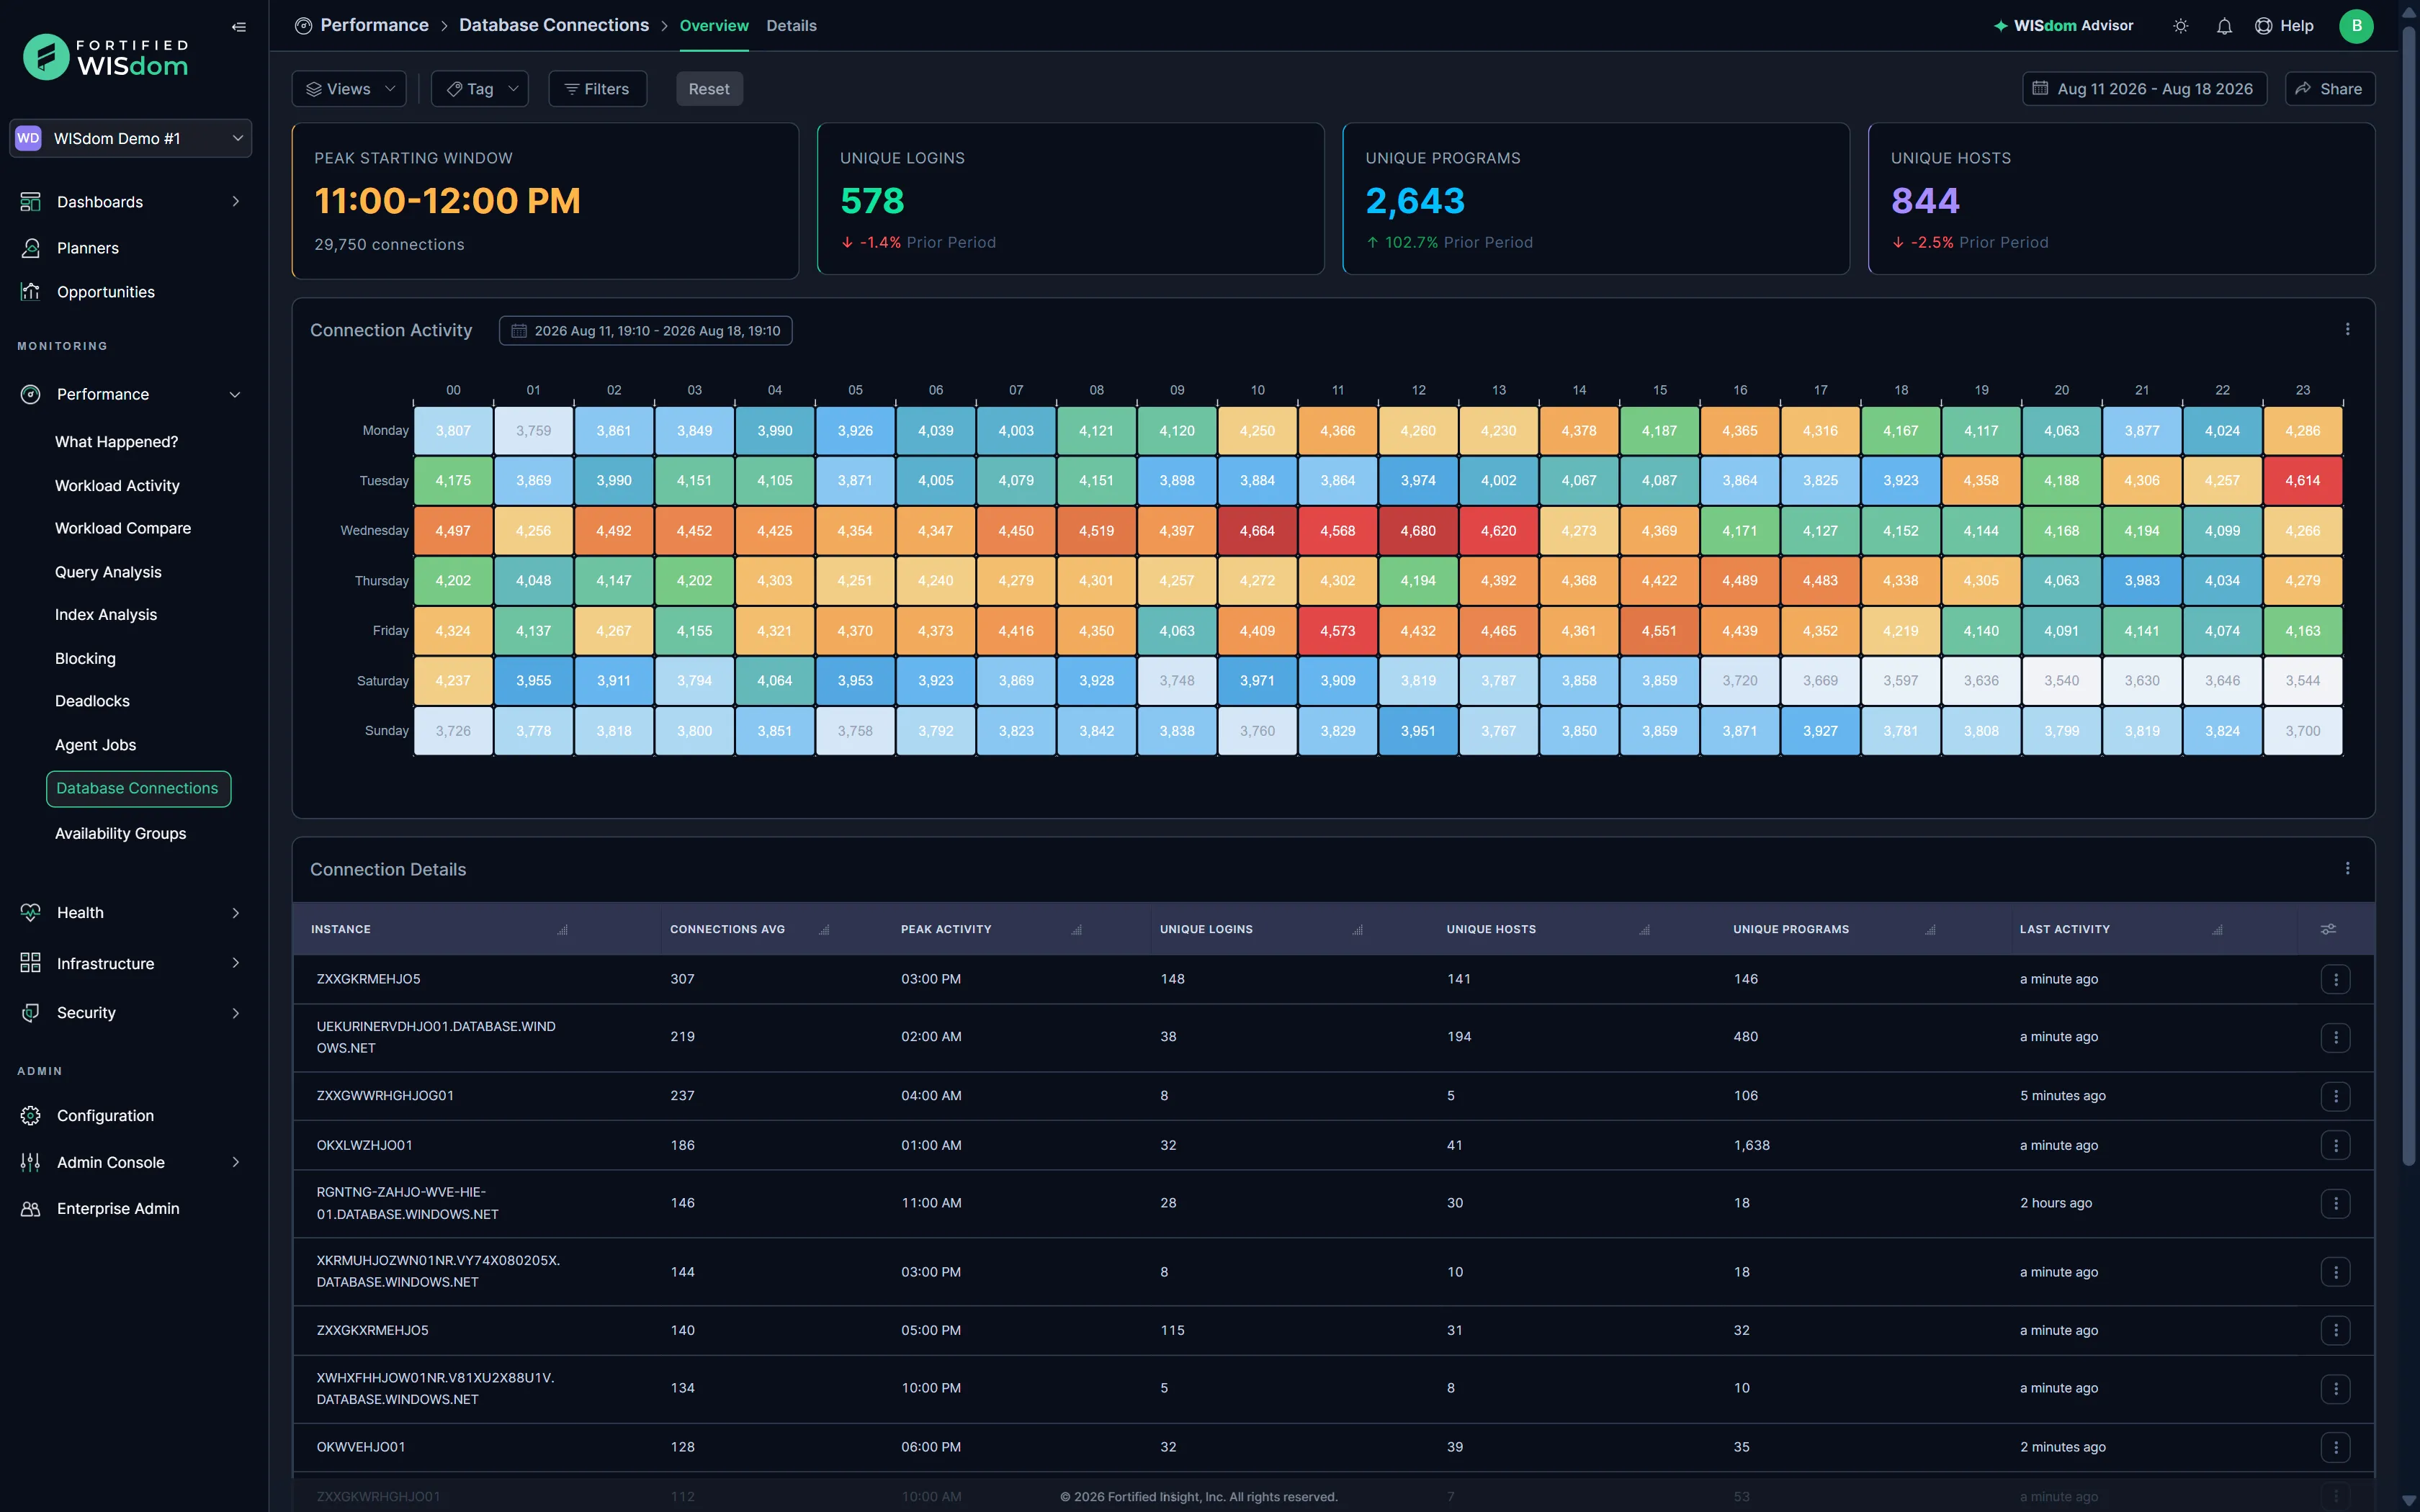
Go to Performance › Database Connections to open the Overview.
Time range, views, and filters
Section titled “Time range, views, and filters”The heat map and the table cover the time range selected in the date picker in the upper right. The default is the last 7 days. Use Views, Tag, and Filters in the toolbar to narrow what is displayed, and Reset to clear all active filters.
Summary cards
Section titled “Summary cards”Four summary cards at the top of the page summarize the selected time range.
| Card | Description |
|---|---|
| Peak Starting Window | The one-hour window with the most connection activity, with the number of connections in it |
| Unique Logins | The number of distinct logins that connected, with the change from the prior period |
| Unique Programs | The number of distinct programs that connected, with the change from the prior period |
| Unique Hosts | The number of distinct hosts that connected, with the change from the prior period |
Connection Activity heat map
Section titled “Connection Activity heat map”The Connection Activity heat map shows connections by day of the week (rows) and hour of the day (columns, 00 to 23). Each cell shows the number of connections, and its color runs from blue for the lowest counts to red for the highest.
The time range you selected is shown in the upper left, next to the Connection Activity title.
The default time range is the last 7 days. When you select a longer time range, connections are grouped into buckets by hour and by day. The totals in each bucket are aggregated amounts for every day in your time range that falls on that weekday, for the same hour.
Connection Details table
Section titled “Connection Details table”The Connection Details table lists every instance with its connection information.
Columns
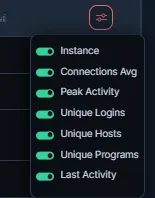
Section titled “Columns”All columns are displayed by default.
| Column | Default | Description |
|---|---|---|
| Instance | Yes | The name of the instance |
| Connections Avg | Yes | The average number of connections to the instance |
| Peak Activity | Yes | The hour with the most connection activity, based on the selected time range |
| Unique Logins | Yes | The number of distinct logins that connected to the instance |
| Unique Hosts | Yes | The number of distinct hosts that connected to the instance |
| Unique Programs | Yes | The number of distinct programs that connected to the instance |
| Last Activity | Yes | How long ago the instance last had connection activity |
To choose which columns are displayed, select the column chooser icon in the upper-right corner of the table and toggle columns on or off. Your selections are kept in your browser cache and persist until the cache is flushed.
Header row actions
Section titled “Header row actions”The action icon (three vertical dots) in the table’s header row offers a full-screen view and an export option. Export creates an Excel file with all available columns, regardless of which columns are displayed. It does not ignore filters: only the data that matches the filters currently applied is exported.
Row actions
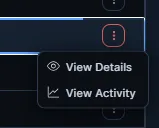
Section titled “Row actions”Select the row-level action icon (three vertical dots at the end of a row) for more options:
- View Details - Open the Details page with the selected instance already applied as a filter. Selecting the row does the same.
- View Activity - Open the Workload Activity screen, filtered by the selected instance.