

Hosts
The Infrastructure › Hosts screen is used to display a list of all Hosts that have been set up in the WISdom collection environment. Host information is displayed in a table format with sortable columns in the Hosts section. A host is either added manually, in which case it has no SQL Server instance associated with it, or discovered automatically after an instance has been added. See what each host costs per year, split into compute, storage, and licensing, next to its CPU, memory, and storage usage, and spot the hosts that are under resource pressure.
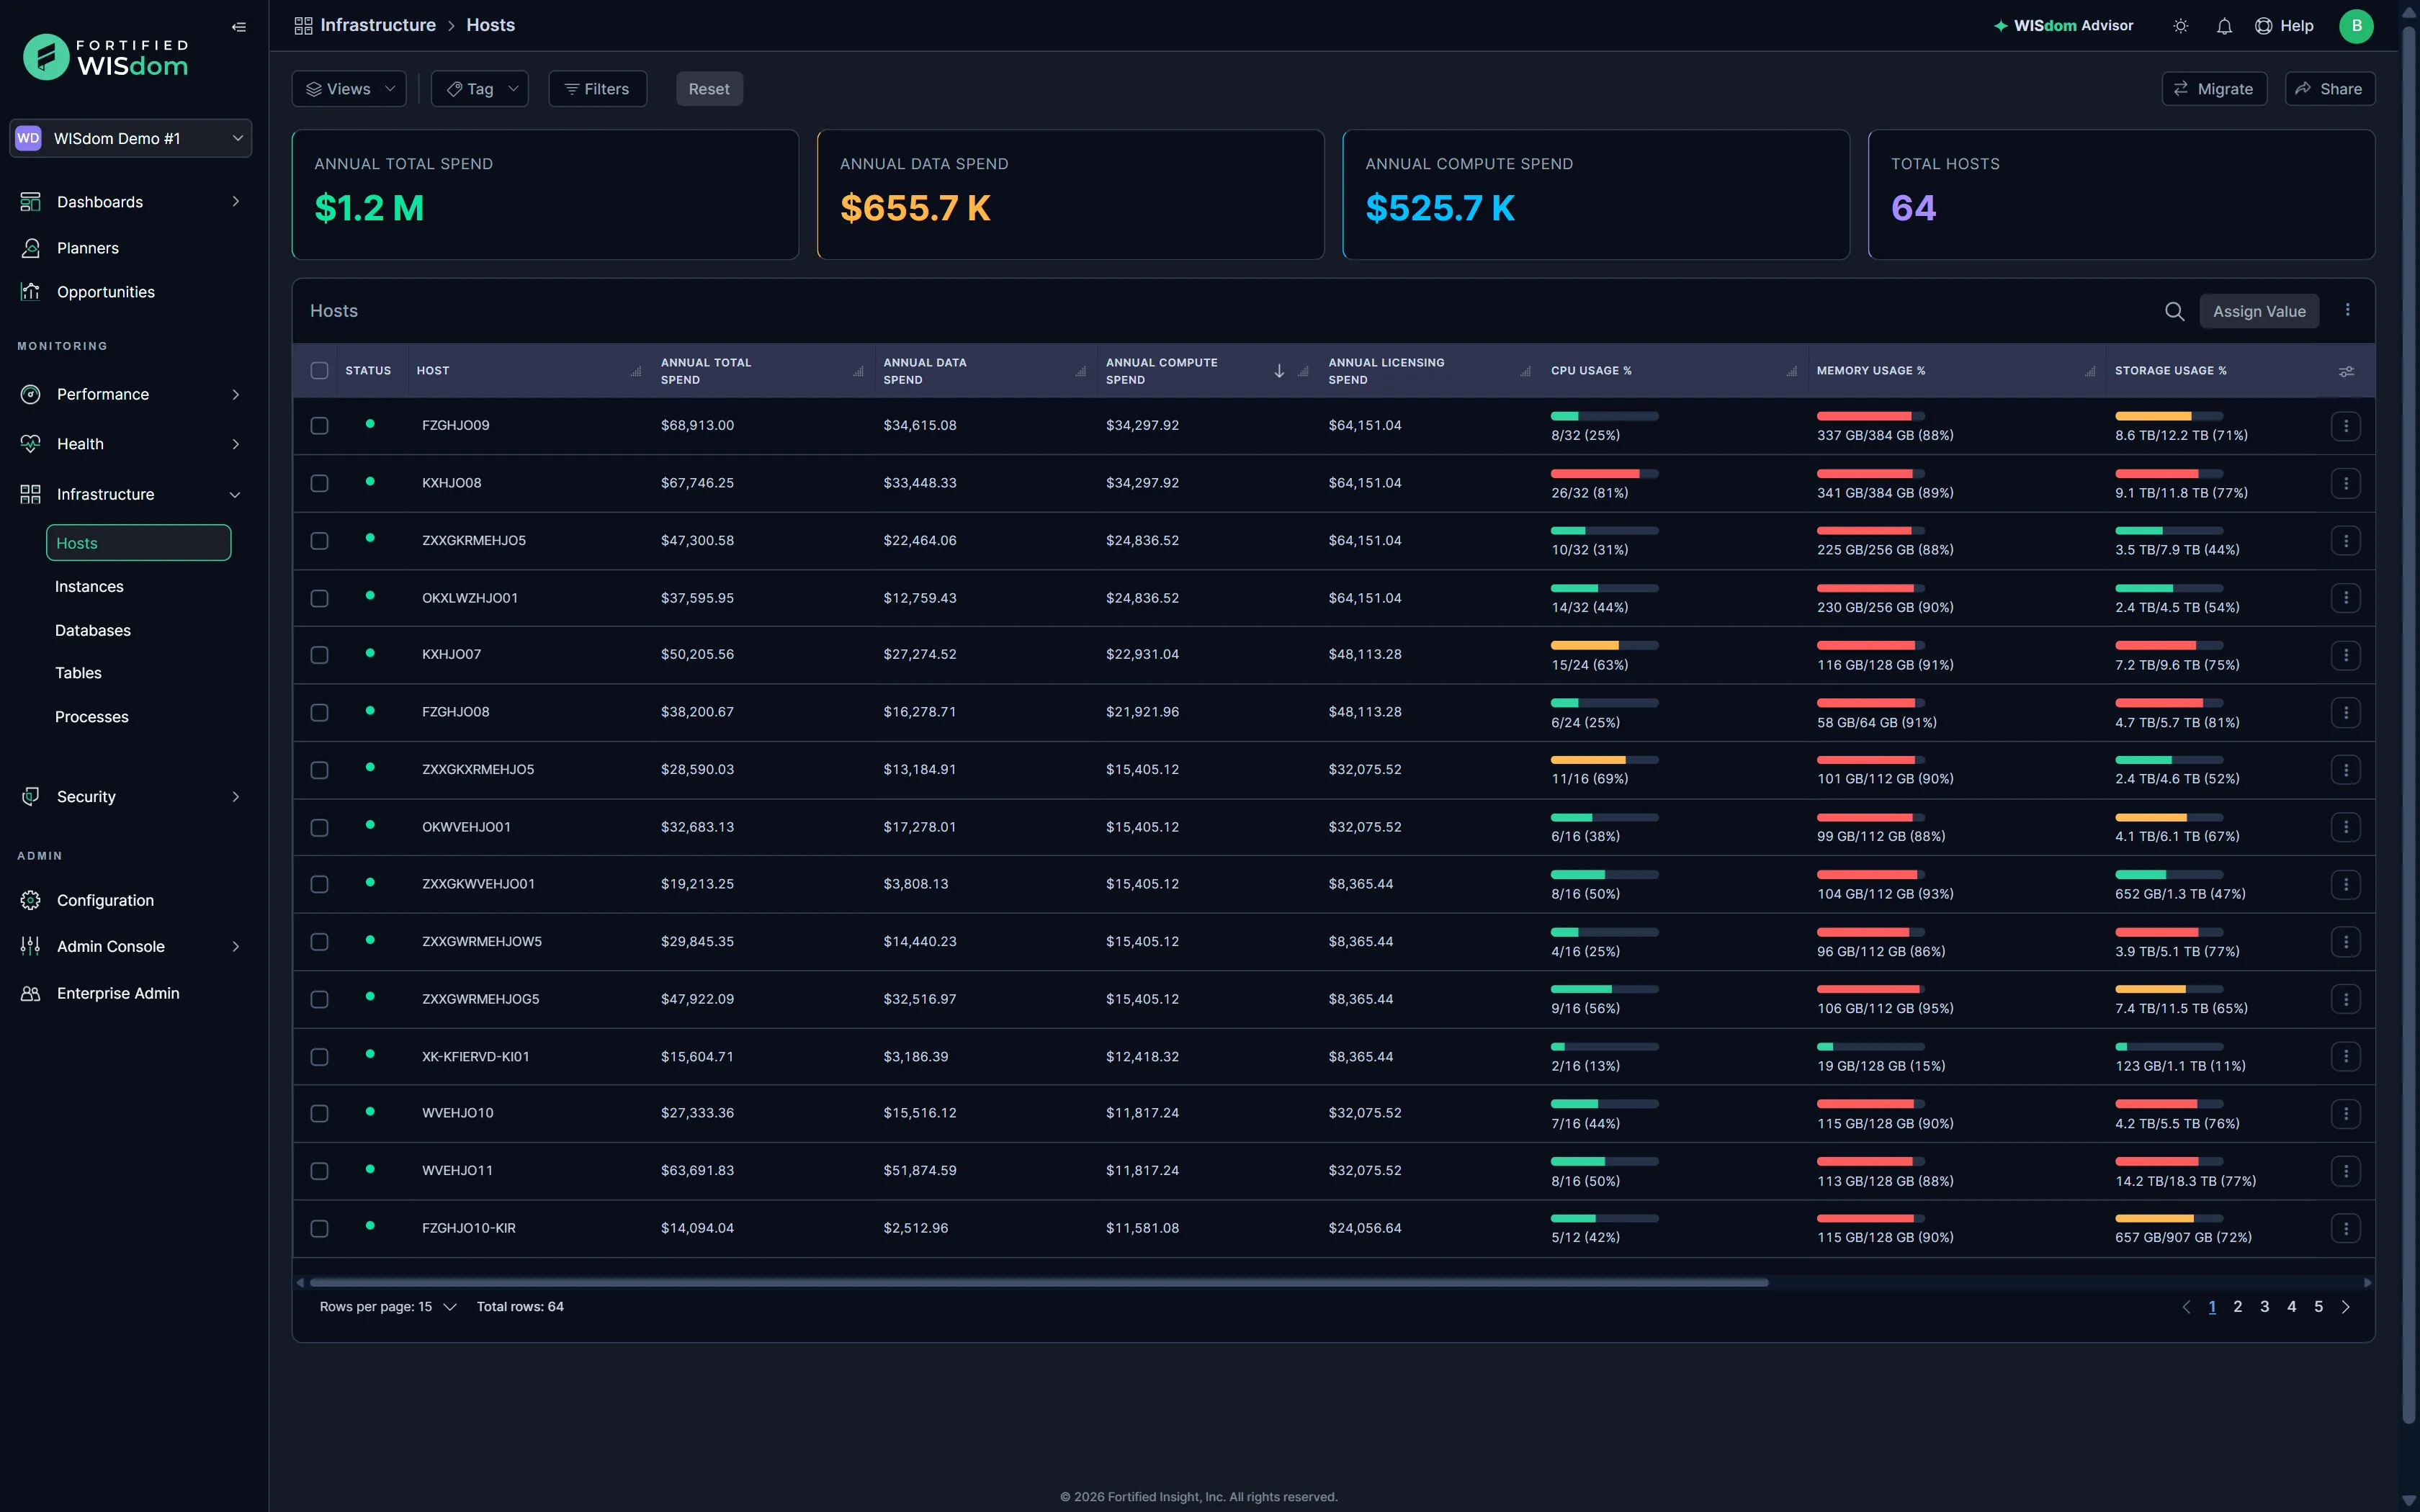
The screen can be modified by selecting a View and applying it, or by using the Tag or Filters drop-downs. Select Apply to apply your selections or Cancel to discard them, and select Reset to clear all active filters.
The Tag drop-down includes the system-generated tags that apply to the page and any custom tags you have created, such as an Application tag. The system-generated tags are [Environment], Auto-Discovered Resource, Availability Group, Collection Status, Listener Name, and Top 10% Instances. [Environment] tags may be edited on the Tags page in the Admin Console, if your WISdom account has the appropriate permissions. The other system-generated tags cannot be edited.
The Filters drop-down offers Host, Host Model, and OS.
The Search area (magnifying glass in the upper right corner of the screen) provides the ability to search for a string or name, further limiting the Hosts displayed in the Hosts table.
Select a host row to open Instances with that host applied as a filter. This is the same as selecting View Instances from the row-level action icon.
To choose which columns are displayed, select the column chooser icon in the upper-right corner of the table and toggle columns on or off. Your selections are kept in your browser cache and persist until the cache is flushed. To export the data, use Export from the action icon (three vertical dots) in the table’s header row. Export creates an Excel file with all available columns, regardless of which columns are displayed. It does not ignore filters: only the data that matches the filters currently applied is exported.
Summary cards
Section titled “Summary cards”Four cards at the top of the page summarize the hosts displayed.
| Card | Description |
|---|---|
| Annual Total Spend | Total annual spend for the hosts: compute, data (storage), and licensing |
| Annual Data Spend | Annual storage cost for the hosts |
| Annual Compute Spend | Annual cost of the CPU cycles consumed by the hosts |
| Total Hosts | Number of hosts displayed |
Spend depends on host information. WISdom applies cost to a resource using the host it runs on, so a cost can only be calculated when host information has been collected. Without host information, or without cloud cost information where it applies, spend may not display. You may see $0 amounts or charts with no data. See Cost Management for how costs are defined.
The Hosts table lists the hosts that have been added to WISdom for monitoring, in sortable columns. Columns marked Default in the table below are displayed until you change them with the column chooser. Use Rows per page at the bottom of the table to change how many hosts are shown. Total rows shows the number of hosts in the table.
Columns
Section titled “Columns”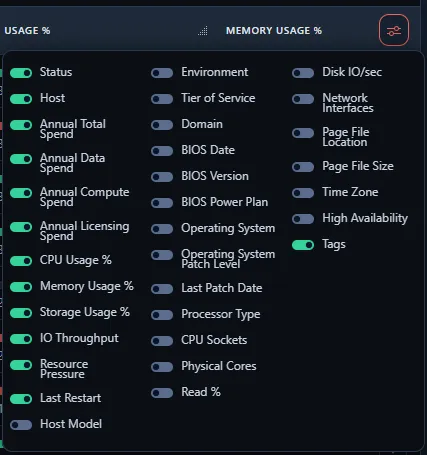
| Column | Default | Description |
|---|---|---|
| Status | Yes | The current health status of the host. |
| Host | Yes | The name of the host. The name is populated when an instance has been added and the collector retrieves the @@ServerName from the SQL Server instance. |
| Annual Total Spend | Yes | Total annual spend for the host: compute, data (storage), and licensing. |
| Annual Data Spend | Yes | The annual storage cost for the host. |
| Annual Compute Spend | Yes | The annual cost of the CPU cycles consumed on the host. It is the total of the compute spend of all processes running on the host. See Processes. |
| Annual Licensing Spend | Yes | The annual SQL Server licensing cost, applied at the host level. A host with multiple SQL Server instances has the same licensing cost as a host with one. |
| CPU Usage % | Yes | CPU usage on the host, as a percentage. |
| Memory Usage % | Yes | Memory usage on the host, as a percentage. |
| Storage Usage % | Yes | Storage usage on the host, as a percentage. |
| IO Throughput | Yes | The observed IO throughput of the host. |
| Resource Pressure | Yes | Badges for the resources flagged as under pressure on the host: CPU, Disk, and Memory. The column is blank when no resource is under pressure. See the Resource Health section under Monitoring. |
| Last Restart | Yes | How long ago the host was last restarted. |
| Host Model | No | The model of the host. |
| Environment | No | The environment assigned to the host, such as Production or Development. You configure this value. It shows [Unassigned] until you assign one. |
| Tier of Service | No | The tier of service assigned to the host. You configure this value. It shows [Unassigned] until you assign one. |
| Domain | No | The domain associated with the host, when available. |
| BIOS Date | No | The date of the host’s BIOS. |
| BIOS Version | No | The version of the host’s BIOS. |
| BIOS Power Plan | No | The power plan reported for the host. |
| Operating System | No | The operating system running on the host. |
| Operating System Patch Level | No | The patch level of the operating system. |
| Last Patch Date | No | The date the operating system was last patched. |
| Processor Type | No | The processor model installed in the host. |
| CPU Sockets | No | The number of CPU sockets on the host. |
| Physical Cores | No | The number of physical cores on the host. |
| Read % | No | The percentage of the host’s I/O operations that are reads. |
| Disk IO/sec | No | The observed disk I/O operations per second on the host. |
| Network Interfaces | No | The number of network interfaces on the host. |
| Page File Location | No | The location of the page file on the host. |
| Page File Size | No | The size of the page file on the host. |
| Time Zone | No | The configured time zone of the host. |
| High Availability | No | A badge showing the high availability configuration of the host, such as AG (Availability Group) or FCI (Failover Cluster Instance). |
| Tags | Yes | The tags associated with the host. |
Row actions
Section titled “Row actions”Select the row-level action icon (three vertical dots at the end of a row) for more options:
- Edit - Manage the tags associated with the host. Edit only manages tags. See Assign value / edit below.
- View Instances - Open Instances with the host applied as a filter. Selecting the row does the same.
- View Processes - Open Processes for the host.
Assign value / edit
Section titled “Assign value / edit”The only information you can edit on this page is Tags. The primary editing related to a Host’s information will be done in the Collections - Resources section of the Admin Console screen.
To edit a single Host, select the Three-Dot icon at the end of the row and select the Edit button. A flyout will appear with the option to edit the Tag(s) associated with the host. To edit Tags for more than one host at a time, check the boxes in front of the host names, then select the Assign Value button at the top-right.
When a Host is selected via the check box at the beginning of the row, the Migrate button becomes operational. When selecting the button, the servers checked will be prepopulated but may be modified when the Migration Recommendations pop up displays. See the Migration page of the User Guide for more details.