WISdom v26.7.0: Reliability Improvements, Enhanced Collections, and Richer Alert Context - Wednesday, June 3, 2026
This release resolves critical export and charting defects, improves multi-instance analysis capabilities, and adds richer context to alert notifications—making your monitoring experience more reliable and operationally efficient.
Enhancements and New Capabilities
📋 Tables — Table Analytics for Infrastructure
Infrastructure › Tables is a new table analytics section that gives you visibility into the size, cost, growth, and access patterns of SQL Server tables across your environment.
- KPI summary cards surface Annual Spend, Savings Opportunity, Cold Data Size, Cold Data Copies, and Annual Growth % at a glance.
- Last Accessed chart categorizes tables into Active (0–30d), Aging (30–90d), Stale (90–180d), and Cold (180–365d) buckets by size, count, or spend.
- 5-Year Growth Projections chart models storage growth trajectories with a Size/Spend toggle to view projections in either dimension.
- The Overview tab shows a table-level grid with Row Count, Size, Read %, Write %, Annual Size Growth, Annual Spend, and Last Accessed.
- The Details tab expands each table across its instances and databases for row-level analysis using the same column set.
Value: Understand exactly where your storage budget is going and where it's headed, without writing a single query. Identify cold and stale tables that drive unnecessary spend, model 5-year growth trajectories in size or cost, and drill from environment-wide totals down to the instance and database levels.
Backup Metadata in Inventory Databases
The Inventory > Databases page now displays last backup time, type, and status with quick-sort and filter support.
Value: Faster compliance verification and backup schedule management without drilling into backup logs. Quickly identify databases with outdated backups, spot backup failures, and ensure your backup strategy is working as expected—all from the inventory screen.
Multi-Chart Saved Views
Save and re-use multi-chart dashboards and templates for consistent analysis across environments.
Value: Build once, use everywhere. Create custom multi-chart dashboards tailored to your specific analysis workflows, then save them for instant access across all your monitored environments. This is especially valuable for teams with standardized performance review processes or recurring analysis patterns—no more manually assembling the same charts every time.
MSP Policy Synchronization
Opportunity policies now sync automatically from MSP tenant to client tenants, reducing manual configuration and policy drift.
Value: Ensure consistent opportunity evaluation across all managed client accounts without manual policy replication. MSPs can now define opportunity policies once at the tenant level and have them automatically applied to all child accounts, eliminating inconsistencies and reducing administrative overhead.
Alert Notifications with Object Tags
Alert payloads now include relevant object tags, providing richer context for routing and triage in external systems.
Value: Smarter alert routing and faster triage in your ticketing, Slack, PagerDuty, or other external systems. Tags included in alert notifications let you automatically route database alerts to the right teams, apply custom workflows, or enrich tickets with environment context—without requiring manual tag lookups or custom mappings.
Critical Bug Fixes
Restored Export Functionality
Exports from Collection > Data Collectors and Resources screens now work reliably, with corrected error handling and UI state management restoring full CSV/Excel export capability.
Value: Get back the ability to export critical collection and resource data for compliance documentation, capacity planning, and infrastructure reporting without encountering errors or failed exports.
Fixed: Performance Chart Zero-Value Rendering
Performance Metric charts for Collection Success now correctly plot zero values, preventing misleading gaps in success-rate trends.
Value: Accurate performance visualization means you won't miss periods of zero activity or failed collection runs. Zero-value rendering is critical for understanding true performance patterns, especially when tracking backup success rates or collection reliability over time.
Fixed: MSP Admin Tenant Switching
MSP Admins and Fortified Admins are no longer redirected to the Onboarding Wizard when switching between client tenants. Users are now returned to their last working context or default dashboard.
Value: Seamless tenant switching means faster navigation between accounts without disruptive redirects. For MSPs managing dozens of client accounts, this eliminates the friction of unexpected onboarding screens and keeps you in your workflow.
Restored: Multi-Instance Filtering in Availability Groups
The Performance > Availability Groups page Instance Filter now supports multi-select, allowing you to compare multiple instances side by side with improved filter chips.
Value: Analyze availability group health across multiple instances simultaneously without toggling filters repeatedly. Compare instance-by-instance performance patterns, replication latency, and failover status in a single view to spot cross-instance trends or anomalies faster.
WISdom v26.6.0: Enhanced Opportunities Management and User Experience Improvements
This release delivers a comprehensive redesign of the Opportunities feature with improved management capabilities, policy controls, and enhanced visibility—making it easier to track, prioritize, and act on optimization recommendations.
IMPORTANT: Post-Update Browser Refresh Required
After this update is deployed, some users may encounter a blank screen when logging in. If this occurs, simply perform a hard refresh of your browser (Ctrl+F5 on Windows, Cmd+Shift+R on Mac) to clear the cached index.html file. This is a one-time action and will not be required for future updates.
Enhanced Opportunities Management
Comprehensive Opportunities Redesign
The Opportunities feature has been completely redesigned across Overview, Details, and Admin interfaces. New capabilities include opportunity policies, improved management workflows, and enhanced details pages that provide better context and actionability for optimization recommendations.
Value: Take control of your optimization workflow with powerful new management capabilities. The redesigned Opportunities Overview gives you better visibility into all optimization recommendations across your environment, while the new Details pages provide richer context to help you understand the impact and effort required for each opportunity. Opportunity Policies let you define rules for which opportunities surface and how they're prioritized—reducing noise and ensuring your team focuses on high-value optimizations that align with your business priorities. The Admin interface gives you centralized control over opportunity management, making it easier to track which recommendations have been addressed, which are in progress, and which should be suppressed based on your operational constraints. This is especially valuable for teams managing hundreds of opportunities across large environments—you can now organize, prioritize, and track optimization work systematically rather than managing it ad-hoc.
Note: Remember to perform a hard browser refresh (Ctrl+F5 or Cmd+Shift+R) if you encounter a blank screen after the update.
WISdom v26.5.0
Interactive Chart Navigation, Custom Alert Scheduling, and Onboarding Improvements — March 31, 2026
This release puts more control in your hands. You can now navigate performance charts forward and backward in time without leaving the screen, set custom evaluation schedules for your own alerts, and onboard new environments through a smoother, more guided setup experience. Several usability improvements round out the release alongside a filter fix in the Alerts module.
New Features
Interactive Chart Time Navigation
All time-based charts across WISdom
All time-based charts in WISdom now include a time navigation toolbar, giving you the ability to move through historical data without adjusting the global date range or leaving the screen. The toolbar is available on every screen that displays a time-series chart — including Performance, Infrastructure, Health, and other modules.
The toolbar appears at the top right of the chart and includes:
| Control | Action |
|---|---|
| « (double left arrow) | Move backward by twice the selected range |
| ‹ (single left arrow) | Move backward by the selected range |
| Range selector | Open a dropdown to choose a preset time range (1h, 6h, 12h, 1d, 3d, 7d, 14d, 30d) that will override the displayed time range |
| › (single right arrow) | Move forward by the selected range |
| » (double right arrow) | Move forward by twice the selected range |
| ↺ (reset) | Resets the time range to the last 7 days from the current time |
The chart automatically adjusts the data aggregation interval based on the range you are viewing.
Tip: Use the single arrows to step through previous or next same time range repeatedly. This is useful when comparing workload patterns across multiple time ranges at the same granularity.
Value: Investigate performance events in context without losing your place. Step backward to pinpoint when a spike began, compare the same time window across different days, or move forward to confirm whether an issue has resolved, or select a predefined larger time range, going backward in time from the selected end date. All without resetting your filters or navigating away from the chart.
Improvements to Existing Features
Custom Alert Evaluation Frequencies
Admin Console › Alerts › Custom Alerts
When creating or editing a Custom Alert, you can now choose how frequently WISdom evaluates your alert query. Previously, Custom Alerts ran on a fixed schedule, every minute. You can now select from four evaluation frequencies:
- Minute — Evaluates every minute
- Hour — Evaluates once per hour
- Daily — Evaluates once per day
- Weekly — Evaluates once per week
Value: Match evaluation frequency to what makes sense for the data you are monitoring. A query that tracks daily batch job failures does not need to run every hour or every minute. Setting a longer interval reduces unnecessary processing, reduces resource utilization on the target, and keeps your alert history focused on meaningful events.
Total Record Count on All Tables
All tables across WISdom
Every table in WISdom now displays the total number of records across all pages available. The count appears on the bottom left of the table, to the right of the Rows per page: selector.
Value: Know the full size of any result set at a glance without paging through to the end. Especially useful when applying filters, by confirming immediately whether a tag, group, or search filter is returning the scope you expect.
New Client Onboarding Wizard
First Login › Onboarding Wizard
WISdom now launches a guided onboarding wizard the first time a new client logs in. The wizard walks through the three essential setup steps: installing the first Data Collector, adding database instances, and inviting team members. It includes links to the perspective areas of the WISdom User Guide.
The wizard will continue to appear at login until it has been either completed or skipped. Once dismissed either way, it will not reappear.
Value: New clients get a structured, step-by-step path through first-time setup instead of navigating the Admin Console from scratch. The wizard ensures nothing critical is missed during onboarding, and the persist-until-complete behavior means setup progress is never accidentally lost between sessions.
Tag Filtering Performance Improvement — Inventory Dashboards
Infrastructure › Inventory Dashboards
Tag filtering on Inventory dashboards has been updated to use server-side API filtering. No changes to the filtering experience are visible in the UI.
Value: Tag filters on large environments now apply faster and more reliably, particularly in environments with a high number of tagged resources.
For questions or feedback, contact the WISdom support team.
WISdom v26.4.0: FinOps Process Overview and Enhanced Dashboards - March 18, 2026
This release introduces a comprehensive FinOps Process Overview to track host process utilization and costs, plus delivers updated dashboard designs for improved visibility and usability.
FinOps Process Overview Screen
Host Process Utilization and Cost Breakdown
New FinOps Process Overview screen provides insight into host process utilization across your enterprise, including a detailed breakdown of cost per process.
Value: Understand exactly which processes are consuming resources and driving costs across your infrastructure. The FinOps Process Overview gives you visibility into resource consumption at the process level, enabling you to identify inefficient processes, runaway applications, or unexpected workloads that are inflating your infrastructure costs. This granular cost attribution is critical for chargeback models, optimization prioritization, and identifying which applications or services are the true cost drivers in your environment. Whether you're optimizing cloud spend, planning capacity, or implementing FinOps practices, process-level cost visibility helps you make data-driven decisions about where to focus optimization efforts for maximum financial impact.
Enhanced Dashboard Designs
Modernized Dashboard Experience
Dashboards have been redesigned with updated layouts, improved data visualization, and enhanced usability across DBA, Host, Instance, and Database dashboards.
Value: Get to critical information faster with cleaner layouts and more intuitive data presentation. The updated dashboard designs reduce visual clutter while surfacing the most important metrics and insights prominently. Whether you're conducting daily health checks, investigating performance issues, or presenting environment status to stakeholders, the modernized dashboards make it easier to understand your environment at a glance and identify areas requiring attention.
Critical Fixes
Fixed: Query Analysis Export Missing Objects
Query Analysis exports now correctly include Object data in the exported file.
Value: Complete export data for analysis, reporting, and documentation. When exporting query analysis data for performance reviews, optimization planning, or sharing with team members, you'll now get all the object information you need without manual data compilation or workarounds.## Statistics Management Opportunities — Redesigned
WISdom v26.3.1
Previously, WISdom surfaced a single opportunity called Enable Automatic Statistics Management that evaluated three SQL Server statistics settings together. Because one of those settings — Asynchronous Statistics Update — is off by default across nearly every SQL Server database, the combined opportunity is triggered for almost every database in most environments. That made it noisy and difficult to act on.
In this release, the three settings have been separated into their own independent opportunities. Each opportunity now evaluates a single configuration and fires only when that specific setting warrants your attention.
The Three New Opportunities
| Opportunity | SQL Server Setting | Default | Fires When |
|---|---|---|---|
| Automatic Statistics Creation is Disabled | AUTO_CREATE_STATISTICS |
ON | The setting is OFF |
| Automatic Statistics Update is Disabled | AUTO_UPDATE_STATISTICS |
ON | The setting is OFF |
| Asynchronous Statistics Update is Disabled | AUTO_UPDATE_STATISTICS_ASYNC |
OFF | The setting is OFF |
This is an advisory finding. Because the async setting is off by default, this opportunity is intentionally informational — it highlights databases where enabling async updates may improve query performance. Whether to act on it depends on your workload. See the guidance below.
Automatic Statistics Creation is Disabled
SQL Server automatically creates statistics on columns used in query predicates when AUTO_CREATE_STATISTICS is enabled. This helps the query optimizer build efficient execution plans without requiring manual statistics management.
When this setting is off, the optimizer must work without statistics on unindexed columns, which can lead to inaccurate row estimates and poor query plans.
When is it intentionally disabled?
Some environments disable auto-create statistics by design:
- Highly controlled environments where a DBA manages all statistics manually to enforce strict standards
- Regulatory or compliance environments that restrict automatic database changes
- Very large databases with frequent ad-hoc queries, where uncontrolled statistics creation adds overhead
- Read-only or static databases where data never changes, and statistics never become stale
If you see this opportunity and the setting is intentionally off, it can be safely dismissed for those databases.
Automatic Statistics Update is Disabled
SQL Server updates statistics automatically when enough data changes occur. Before SQL Server 2016, this happened only after 20% of the rows plus 500 additional rows were modified. Starting in SQL Server 2016, a new algorithm lowers the threshold for large tables, allowing their statistics to update sooner. Keeping statistics current helps the optimizer generate accurate execution plans as data changes.
When this setting is off, statistics become stale over time. Stale statistics lead to suboptimal query plans, which can cause performance degradation that is difficult to diagnose.
When is it intentionally disabled?
Auto update is on by default and should remain on for most databases. There are specific scenarios where DBAs choose to disable it:
- Highly predictable or static workloads where data distributions rarely change
- Large ETL processes where statistics are temporarily disabled during bulk loads and then manually refreshed afterward
- Real-time or latency-sensitive systems (such as trading platforms) where the overhead of a statistics update during query compilation is unacceptable
- Very large databases with heavy write workloads where automatic updates cause blocking or plan recompilations at critical times
- Databases using partitioned tables with incremental statistics, where auto-update can trigger full table scans instead of partition-level updates
In most cases where Auto Update causes performance problems, enabling Asynchronous Statistics Update is the better solution — it removes the compilation delay without sacrificing freshness. Disabling Auto Update entirely should be a last resort.
Asynchronous Statistics Update is Disabled
By default, when SQL Server detects that statistics are stale, it then updates them synchronously, causing the query to wait for the statistics update to complete before the execution plan is compiled. In most environments, this delay is imperceptible. In high-concurrency or latency-sensitive environments, it can cause noticeable waits.
When AUTO_UPDATE_STATISTICS_ASYNC is enabled, SQL Server compiles and executes the query immediately using the existing statistics, then updates the statistics in a background thread. Future queries benefit from the refreshed statistics.
When should you consider enabling it?
- Large tables in OLTP or high-concurrency environments where synchronous updates introduce blocking or query latency
- Latency-sensitive workloads where query compile time needs to be consistent and predictable
- Highly transactional systems with frequent inserts, updates, and deletes, where statistics updates are frequent and the synchronous wait adds up
Auto Update Statistics must be enabled for Async to have any effect. Enabling Async on a database where Auto Update is disabled has no impact.
Async statistics updates mean queries may occasionally compile against slightly stale statistics. In most workloads, the resulting plans are still good enough. In environments where data distributions change dramatically — such as after a bulk load or a table truncation — synchronous updates ensure the freshest statistics are used. Always test before changing this setting in production.
WISdom v26.3.0: System Alerts Integration and Reporting - March 4, 2026
This release integrates critical system-level alerts across WISdom, introduces a powerful new reporting framework, and enhances WISdom Advisor with contextual guidance—ensuring you never miss important alerts and can automate reporting workflows.
System Alerts Integration
System-Level Alerts in Main Alerts Screen and DBA Dashboard
System alerts are now fully integrated into both the main Alerts screen and the DBA Dashboard Top Alerts view, alongside your existing database alerts. New Collector filtering and Resource Type columns provide complete visibility into system-level issues.
Value: Never miss critical system alerts that could impact your entire monitoring infrastructure. Previously, system-level alerts—like collector connectivity issues, configuration problems, or infrastructure failures—weren't surfaced alongside your database alerts, creating blind spots during incident response. Now, when a collector goes offline or encounters issues, you'll see it in the same alert views you're already monitoring. The new Collector filter and Resource Type column help you quickly identify whether an alert relates to an Instance, Host, or Collector, streamlining troubleshooting when system-level issues cascade into database performance problems. This unified alert view means you have a complete picture of your environment's health in one place.
WISdom Reporting (Beta)
Automated Report Configuration and Delivery
WISdom Reporting beta is now available, allowing you to configure report templates and delivery schedules directly within the UI. Design your reports, set delivery schedules, and automate distribution—all from the new Reports section.
Value: Eliminate manual report generation and stop copy-pasting data into spreadsheets for weekly status updates. Configure report templates once, schedule automated delivery to stakeholders, and let WISdom handle the rest. Whether it's executive summaries for leadership, compliance reports for auditors, or detailed performance reports for technical teams, automated reporting saves hours of manual work while ensuring consistency and timeliness. This is especially valuable for recurring reports like monthly capacity reviews, weekly alert summaries, or quarterly performance trends—set it up once and never miss a delivery deadline.
WISdom Advisor Enhancements
Contextual Prompt Suggestions
WISdom Advisor now offers suggested prompts based on the page you're viewing, helping you understand the various ways you can interact with Advisor for context-specific insights.
Value: Stop wondering what to ask Advisor. Context-aware prompt suggestions guide you to the most relevant and powerful queries for each screen you're viewing. When you're on the Query Statistics page, see prompts tailored to query analysis. On the Blocking screen, get suggestions for investigating blocking chains. This guided experience helps both new users discover Advisor's capabilities and experienced users leverage advanced features they might not have explored. Less time figuring out how to phrase questions, more time getting actionable answers.
Enhanced User Guide Support
Improved integration with WISdom's user guide documentation provides more accurate and comprehensive answers when you ask Advisor about product features and capabilities.
Value: Get better answers to "how-to" questions without leaving the application. When you ask Advisor how to configure an alert, interpret a metric, or use a specific feature, the enhanced user guide integration delivers more precise, documentation-backed responses. This reduces the need to search external documentation or contact support for feature clarification.
WISdom Connect Enhancement
Alert Details Link in Webhook Payload
WISdom Connect webhooks now include a direct link to alert details as part of the payload.
Value: Jump straight from webhook notifications to the relevant WISdom alert details page. The included link in the webhook payload takes you directly to the full alert context in WISdom—no manual navigation or searching required. This accelerates incident response by reducing the time between webhook notification and investigation, especially valuable during critical incidents when every second counts.
WISdom v26.2.0: Smarter Navigation, Storage Planning, and Enhanced Visibility - February 18, 2026
This release delivers powerful new planning tools, smarter contextual navigation, and key usability improvements that make it easier to manage your environment and act on insights faster.
Storage Planner
Automated Storage Capacity Projections
The new WISdom Storage Planner automatically projects storage capacity using all the data WISdom has collected about your environment, making capacity planning faster and more accurate than ever.
Value: Stop guessing when you'll run out of storage. The Storage Planner uses your actual historical growth patterns to project future capacity needs, giving you data-driven forecasts you can act on before storage becomes a crisis. Whether you're planning infrastructure purchases, cloud migrations, or simply trying to avoid unexpected outages, the Storage Planner gives you the visibility to plan with confidence. This is especially valuable when presenting capacity plans to leadership or finance teams—you can back your recommendations with real data from your own environment.
"What Happened?" Status Banner
Instant Environment Health at a Glance
The "What Happened?" screen now features a dynamic status banner that immediately communicates the health of your environment. The banner displays green for healthy states, yellow for warnings, and red for critical issues—each with a concise summary of what's happening and when it occurred.
Value: Know the state of your environment the moment you open "What Happened?" without scanning through data to piece together the picture. A green "All Good" banner with the time since the last change tells you everything is running smoothly. A critical red banner immediately surfaces the number of issues with precise timestamps—"2 critical alerts at 14:32. 1 deadlock at 15:01"—so you can jump straight to resolution. This contextual health summary serves both DBAs who need technical detail and decision-makers who need a quick status read.
Smarter Contextual Navigation
Availability Groups Performance History Link
The Availability Groups screen now consolidates Primary and Secondary Replica tables into a single unified Replicas table with a direct History button, linking each replica to its Performance Metrics screen filtered to the selected instance and current date range.
Value: Move from availability group health to performance history in one click, without manually navigating and re-applying filters. The consolidated Replicas table reduces visual complexity while adding direct access to the performance data you need for deeper investigation.
Database Connections Performance Metrics Link
Both the DB Connections Overview and Details screens now include a direct link to Performance Metrics using the User Connections → Transactions template, auto-filtered to the relevant instance.
Value: Instantly jump from connection data to performance metrics without losing context. When investigating connection spikes or unusual transaction patterns, moving between screens no longer means re-applying filters or losing your place—the link carries your context directly to the right performance view.
SSO PKCE Authentication Support
More Secure SSO Configuration
SSO setup now supports PKCE as an authentication flow option, eliminating the need to store client credentials in your SSO configuration.
Value: Improve your security posture by removing stored client credentials that can expire or be compromised. PKCE is a modern, more secure authentication flow that simplifies SSO configuration while reducing risk—particularly valuable for organizations with strict security requirements or frequent credential rotation policies.
Redesigned Subscription Page
Clear Subscription and License Visibility
The Subscription page has been fully redesigned with a dashboard-style summary showing Subscription Period, Active Products, Total Licenses, and Annual Total in a clean, easy-to-read layout.
Value: Instantly understand your WISdom investment at a glance. Account owners and authorized users can quickly review subscription details, license counts, and annual costs without navigating multiple screens or contacting support. The new design makes it easier to track renewal dates, manage license usage, and export subscription data for internal reporting or budget planning.
Data Visualization Improvements
Null vs. Zero Distinction in Histograms
Histograms now visually distinguish between null values and zero values, providing a more accurate representation of your data.
Value: Understand the difference between "no activity occurred" and "data was not collected" at a glance. This distinction is critical when troubleshooting gaps in monitoring coverage or analyzing workload patterns—you'll no longer confuse missing data with genuine zero-activity periods.
Query Statistics Minimum 1-Hour Interval
Query Statistics now requires a minimum 1-hour time selection to ensure at least one aggregation interval is always included in results.
Value: Eliminate confusing empty result sets caused by selecting time ranges that fall between hourly aggregations. The enforced minimum ensures you always get meaningful data when querying performance statistics, reducing troubleshooting time and confusion.
Additional Improvements
Maintenance Window Name and Status Updates
Improved maintenance window management with updated name and status handling for more accurate tracking.
Value: Better visibility into maintenance window state and naming, reducing confusion when managing scheduled maintenance across multiple instances.
Critical Fixes
Fixed: Infrastructure Database Sorting
Database and Instance columns in the Infrastructure screen now sort correctly by name in both ascending and descending order.
Value: Quickly find specific databases or instances in large environments without workarounds. Accurate sorting means less time scrolling and more time acting on the data you need.
Fixed: Opportunities Display Truncation
Opportunity names are no longer truncated, and multiple impact values now display correctly in the Impact column.
Value: See complete opportunity information without having to drill into each record. Full opportunity names and accurate impact data help you prioritize optimization work more effectively.
WISdom v26.1.0: Custom Alerts, Enhanced Data Export, User Experience Improvements - February 4, 2026
This release focuses on making WISdom work smarter for you with support for custom alert queries, AI-powered data exports, extended graphing capabilities, and streamlined authentication—plus critical fixes based on your feedback.
🔍 Custom Alerts
SQL Query-Based Custom Alerts and Improved Viewing
New "Custom Monitoring Queries" allow you to create alerts based on your own custom SQL queries that integrate seamlessly into WISdom's existing robust alerting solution. Write SQL queries to build your alerts around, giving you full control over exactly what WISdom monitors. This powerful feature includes added safeguards to prevent destructive mistakes. In addition, we've improved how you view and filter on alerts for easier management.
Value: Supercharge WISdom alerting to support any of your specific business needs. Instead of relying solely on predefined alert types, you can now write custom SQL queries that define exactly what to monitor and when to alert. This opens up virtually unlimited alerting possibilities—whether it's tracking specific application behavior, monitoring business-critical data conditions, or flagging environment-specific configurations that matter to your organization. Your custom alerts work alongside WISdom's proven system alerts, giving you the best of both worlds—out-of-the-box monitoring for common scenarios plus the flexibility to monitor anything unique to your environment.
🤖 WISdom Advisor Export Capabilities
Export to Excel or JSON
WISdom Advisor can now export data directly to Excel or JSON formats based on the data type. Simply ask Advisor "Export my list of databases to a file" or a similar command and get instant, formatted exports.
Value: Transform AI-generated insights into shareable reports without manual copy-paste work. When Advisor surfaces a list of problematic queries, resource-constrained servers, or configuration issues, export that data directly to Excel for distribution to your team or further analysis. This bridges the gap between AI insights and actionable reports, making it easier to share Advisor's findings with stakeholders who need formatted data rather than conversational responses.
🌙 Dark Mode
Night Mode Theme
WISdom now offers a dark mode theme option, providing a comfortable viewing experience in low-light environments.
Value: Reduce eye strain during late-night incident response or extended monitoring sessions. Dark mode is especially valuable for NOC environments, after-hours on-call work, or DBAs who prefer darker interfaces. Toggle between light and dark themes based on your environment and preferences, making WISdom more comfortable to use throughout your entire workday.
🔐 Streamlined Authentication
Simplified Login Experience
WISdom no longer forces re-authentication on every login page visit. Authentication timing is now controlled by your identity provider settings.
Value: Reduce login friction while maintaining security through your organization's SSO policies. If your identity provider session is still valid, you'll get straight to work instead of repeatedly entering credentials. This respects your organization's established authentication policies while eliminating unnecessary login prompts that slow down your workflow.
🔔 Critical Notification Banner
System-Wide Alert Banner
New notification banner appears across all screens when critical system notifications are issued. The banner is dismissible once per message.
Value: Stay informed about critical system events, maintenance windows, or important announcements without checking email or dedicated status pages. The banner ensures you see time-sensitive information regardless of which screen you're working in, while the dismissible design prevents notification fatigue once you've acknowledged the message.
⏰ Daylight Saving Time Support for Silencing Windows
DST-Aware Silencing Windows
One-time silencing windows now correctly handle Daylight Saving Time transitions by applying the appropriate UTC offset for the specified date.
Value: Schedule maintenance windows across DST transitions without worrying about alert suppression starting or ending at the wrong time. This is especially critical for overnight maintenance windows scheduled near DST changes—your alerts will be silenced for exactly the time period you intended, regardless of time zone shifts.
📑 Enhanced Index Flyout
Updated Index Interface
Updated index flyout interface with improved layout and data presentation.
Value: Get better visibility into index usage patterns, storage consumption, and optimization opportunities with a more intuitive interface. The enhanced flyout makes it easier to assess whether indexes are serving their purpose or consuming resources without value.
🔌 WISdom Connect Enhancement
List Users Operation Support
WISdom Connect now supports the List Users operation, allowing you to programmatically query for a list of users under a given account.
Value: Greater flexibility for integrating WISdom user management into your existing workflows and tools. Whether you're building custom dashboards, automating user provisioning, or syncing user data across platforms, the ListUsers operation gives you direct access to account user information through the API—no manual lookups required. This is especially valuable for enterprise and MSP environments managing multiple accounts and teams.
🐛 Critical Fixes
Fixed: Opportunities Not Refreshing When Switching Clients
Opportunities screen now properly refreshes when switching between clients, eliminating stale data display.
Value: Accurate opportunity data for each client without page refreshes or workarounds. When managing multiple clients, you can now trust that the optimization recommendations you're viewing match the selected client.
Fixed: Agent Job Export Missing Last Run Time
Job Scheduled exports now include the Last Run Time column that was previously missing despite being visible in the UI.
Value: Complete export data for compliance documentation, capacity planning, or troubleshooting job scheduling issues. The exported data now matches what you see on screen, eliminating the need for manual data compilation.
WISdom v26.0.0: New Navigation and Sharing Capabilities
🚀 NEW Navigation Structure
Complete Navigation Redesign
WISdom's navigation has been reorganized around workflows and role-based needs.
New Navigation Structure:
- Dashboards - Quick access to DBA, Host, Instance, and Database dashboards
- Planners - Renamed from Calculators for clarity
- Opportunities - Elevated to top level for faster access
- Performance - Default expanded section with "What Happened?" plus Workload Activity, Query Analysis, Blocking, Deadlocks, and more
- Health - Renamed from Monitoring, housing Alerts, Resource Health, and Performance Metrics
- Infrastructure - Renamed from Inventory for clearer categorization
- Security - Renamed from Compliance with clearer labels like "Audit Events" and "Logins and Users"
- Admin Console - Streamlined settings with Collector Health nested under Collection
Value: The new structure mirrors how database professionals work. Performance features are grouped together and expanded by default. The elevated "What Happened?" feature provides one-click access to root cause analysis. Role-based organization helps DBAs, infrastructure teams, and security professionals navigate to their most-used features intuitively.
🔗 "Share This Page" Collaboration Feature
Share Exact Views with One Click
New "Share" button on major dashboard and overview pages lets you share your exact view—including all filters, date ranges, and selections—via copy link or email.
Available on: Environment overviews, all Inventory pages, Database overviews, Monitoring (Alerts and Resource Health), and all Compliance overview pages.
Value: Share performance issues or patterns instantly with colleagues who will see precisely what you're seeing with all filters and context preserved. This streamlines incident response, knowledge sharing during handoffs, and collaborative troubleshooting. Documentation becomes as simple as sharing a link.
🔍 Enhanced Filtering and Job Organization
Improved Filtering Process with Job Tagging
New filtering framework provides faster, more intuitive filtering across all WISdom screens, including job filtering and tagging capabilities.
Value: Filter complex datasets more efficiently with improved performance. Enhanced job filtering and tagging let you organize SQL Agent jobs by custom categories—business function, criticality, maintenance windows, or any organizational scheme. Quickly isolate ETL jobs, backup jobs, maintenance tasks, or business-critical processes without memorizing job names. Especially valuable for large environments with hundreds of jobs.
🎯 Enhanced Analysis Features
Lead Blocker Always on Top
Blocking Details flyout now automatically sorts to display the Lead Blocker as the top row, with remaining records sorted by Session ID.
Value: Instantly identify the root cause of blocking chains without scrolling through pages of blocked processes. The lead blocker is now always at the top where you need it, accelerating blocking investigations in complex environments.
Blocking Drill-Through in New Tab
Blocking investigations now open in new tabs, preserving your original context.
Value: Investigate multiple blocking chains simultaneously without losing your place. Keep your overview screen open while drilling into specific blocking scenarios in separate tabs.
Evaluation Frequency in Opportunities
Opportunity flyouts now display how frequently each opportunity is evaluated.
Value: Understand the recency and reliability of opportunity recommendations. Know whether you're looking at real-time data or periodic assessments to prioritize actions with confidence.
🤖 WISdom Advisor Improvements
More Concise and Contextual Responses
WISdom Advisor AI Agent now delivers tighter, more relevant answers tailored to your specific context.
Value: Get information faster without verbose explanations. Improved response quality means less time interpreting AI outputs and more time taking action. Advisor better understands what you're trying to accomplish and provides actionable guidance.
📊 User Experience Enhancements
New Standardized Date Picker
Modern date picker control rolled out across all screens for improved usability and consistency.
Value: Select date ranges more intuitively with a consistent experience across WISdom. The new control handles complex date selections more elegantly and reduces errors.
Auto-Sizing Object Names in Query Statistics
Instance and Database columns now intelligently size to display full names, with manual adjustments persisting across sessions.
Value: WISdom remembers your column width preferences and automatically accommodates longer names with smart space allocation. See full context at a glance without manual adjustments on every screen visit.
🐛 Fixes
Fixed: Tag Selector Scrolling
Tag selector in Admin Console now properly scrolls when lists extend beyond screen boundaries, particularly for large tag groups like Production.
Value: Access all tags regardless of list size. Browse and select tags naturally even in large, nested tag hierarchies without workarounds.
WISdom v25.31.0: Enhanced Analysis Tools and Improved Workflows
This release expands AI-powered insights, introduces a new schema change cost planner, and delivers improvements to alerts, exports, and job monitoring based on your feedback.
🤖 "Ask Advisor" Expansion
AI Assistant Now Available in Key Flyouts
WISdom Advisor's "Ask Advisor" is now integrated into Activity, Query Statistics, Blocking, and Deadlocks flyouts, providing contextual AI-powered explanations.
Value: Get instant AI-powered explanations of data without leaving your investigation workflow. When you're drilling into a problematic query, blocking chain, or deadlock scenario, click on the corresponding "Ask Advisor" image to have it explain what you're seeing in plain language, suggest potential causes, and recommend next steps. This contextual intelligence accelerates troubleshooting by eliminating the need to interpret complex metrics manually or search through documentation—the answers come to you in the context of your specific investigation.
Calculators are now called Planners
Navigation Name Change
To better represent our growing list of capabilities around "Calculators", we've renamed those calculators to Planners.
💰 Schema Change Cost Planner
New Tool for Estimating Schema Change Impact
A comprehensive cost planner helps you estimate the financial impact of database schema changes by selecting instances, databases, tables, and actions, then configuring cost parameters.
Value: Make informed decisions about schema changes by understanding their true cost before implementation. Whether you're adding indexes, modifying tables, or restructuring databases, the calculator provides cost projections based on your specific environment and workload patterns. This is especially valuable when presenting change requests to leadership or finance teams—you can now quantify the expected resource consumption and associated costs of proposed schema modifications, helping you prioritize changes that deliver the best ROI.
📊 Jobs Anomaly Detection
Machine Learning for Job Runtime Analysis
Jobs screen now includes anomaly detection for job runtime, automatically identifying outliers and potential issues.
Value: Catch job performance degradation early by automatically spotting when jobs run significantly longer than their historical patterns. Instead of manually monitoring job durations or discovering issues through user complaints, WISdom flags anomalous job behavior proactively. This helps you identify deteriorating query plans, growing data volumes, or resource contention issues before they impact business processes—especially critical for overnight batch jobs or scheduled maintenance windows where delays cascade into business hours.
📋 Enhanced Export Capabilities
Resource Health Export
New export functionality for the Resource Health screen, providing comprehensive health score data across all instances.
Value: Export complete resource health data including host and instance health scores, CPU/memory/storage pressure percentages, and contention metrics for reporting, trending analysis, or capacity planning presentations. This is particularly valuable for infrastructure reviews, executive reporting, or documenting baseline performance before major changes.
Improved Alert Details Export
Alert Details exports now include Duration (displayed as days + time), Message column, and properly formatted Alert Categories.
Value: Get complete alert data for incident reports, compliance documentation, or trend analysis without manual data cleanup. The fixed Alert Categories display and added duration/message fields provide the complete context needed for post-incident reviews or sharing alert information with external teams.
🔍 Alert Management Improvements
Filter Alerts by Alert ID
Users can now filter alerts by specific Alert ID on the Alert page, allowing you to quickly view individual alerts referenced from alert notification emails.
Value: Quickly locate specific alerts when working from incident tickets, email notifications, or handoff notes. Instead of scrolling through alert lists or using multiple filters, jump directly to the alert you need by ID—streamlining incident response and reducing time spent searching.
Fixed: Alert Status Filter in Views Alert Status filters now work correctly when included in saved Views, properly honoring Open/Closed status selections alongside other filter criteria.
Value: Your saved alert views now work as expected, maintaining alert status filters when applied. Teams that rely on views for daily alert triage—such as "Open Critical Alerts" or "Closed Alerts This Week"—can now trust that their views will display the correct alert set every time.
WISdom v25.30.1 - Bug Fix Release
This maintenance release corrects the Peak Activity Hour calculation in Query Statistics to provide statement-specific insights.
🐛 Bug Fixes
Peak Activity Hour Display - Query Statistics Details
Corrected Peak Activity Hour Calculation for Individual Statements
The Peak Activity Hour metric on the Query Statistics - Details page now accurately displays the peak activity hour for the specific SQL statement being viewed, rather than showing the peak activity hour for the entire instance or database.
What Changed:
When viewing query details, the Peak Activity Hour card previously showed when the instance or database experienced its highest overall activity, regardless of when the displayed statement actually executed most frequently. This has been corrected to show the hour when the specific statement had its highest execution activity.
Value: Gain accurate insights into when individual queries are most active, enabling better optimization decisions and workload scheduling. Database administrators can now correctly identify peak execution times for specific queries to plan maintenance windows, optimize execution schedules, or target performance tuning efforts when queries experience their highest load. This fix eliminates confusion between instance-level and statement-level activity patterns, ensuring the Peak Activity Hour metric provides meaningful, actionable data for the query being analyzed.
WISdom v25.30.0: Enhanced Collector and Host Management
This release streamlines collector and host configuration with new management capabilities that give you greater control and flexibility over your monitoring infrastructure.
🔧 Collector Management Enhancements
Rename Data Collectors
Users can now rename collectors directly in the Admin section, providing better organizational capability for managing multiple collectors across your environment.
Value: Keep your collector naming aligned with your infrastructure changes and organizational standards without recreating collectors from scratch. Whether you're reorganizing your monitoring architecture, aligning with new naming conventions, or simply correcting initial setup mistakes, renaming collectors means your WISdom environment stays organized and intuitive. This is especially valuable for teams managing dozens of collectors across multiple environments—clear, consistent naming reduces confusion and makes it easier to identify which collector monitors which infrastructure.
⚙️ Host Configuration During Instance Setup
Configure Host Settings When Adding Instances
Users can now configure host-level settings directly when adding new instances to WISdom, streamlining the initial setup process and asynchronous host discovery.
Value: Complete your instance setup in one workflow instead of adding the instance first and then going back to configure host settings separately. This consolidated approach reduces setup time and ensures host configurations are properly set from the start, eliminating the risk of forgetting to configure host-level monitoring or collection settings. For teams onboarding new database instances regularly, this streamlined process means faster deployment and fewer configuration errors.
WISdom v25.29.0: Modernized Inventory and Enhanced Navigation
This release improves how you navigate and understand your database environment. Updated Inventory modules, enhanced Activity and Query Statistics interfaces, and streamlined collector setup mean less clicking, clearer insights, and faster time to value.
🔍 Activity Overview "What Happened" Context
New Contextual Analysis Dashboard
Activity Overview now provides comprehensive explanations of what happened during database activity events at specific times across your instances, integrating activity patterns with performance insights.
Value: Troubleshoot issues faster with immediate context about what triggered activity changes—whether it's a sudden spike in executions, resource contention, or workload shifts. Instead of piecing together information from multiple sources or guessing at root causes, you get clear explanations right where you need them. Technical users like DBAs and engineers gain precise activity insights for rapid troubleshooting, while decision-makers can quickly review historical activity patterns to understand performance impacts and trends. The integrated context eliminates the frustrating gap between seeing an activity spike on a chart and understanding the underlying cause, accelerating your mean time to resolution.
📊 Inventory Modules Updated
Host, Instance, and Database Screens
New layouts with enhanced data visualization, improved organization, and prominent health indicators that surface critical information immediately.
Value: Spot resource constraints, configuration issues, and anomalies at a glance without drilling through multiple screens. The updated inventory screens bring key metrics like CPU utilization, memory pressure, storage capacity, and database health to the forefront, making it easier to identify servers or databases that need attention. Whether you're doing capacity planning, troubleshooting performance issues, or conducting routine health checks, the modernized inventory views give you the information you need faster.
🧭 Navigation & Organization Improvements
Query Statistics Top Statements Grouping
Hierarchical organization of query data replaces flat lists, allowing you to group and analyze queries by logical categories and patterns.
Value: Identify patterns across related queries and quickly see which query families or workload types consume the most resources. The hierarchical view reduces information overload when you're dealing with thousands of queries, making it easier to prioritize optimization efforts. Instead of scrolling through endless flat lists, you can collapse and expand query groups to focus on what matters most for your current investigation.
Activity Overview Breadcrumb Navigation
Nested tables replaced with intuitive breadcrumb trails that show exactly where you are in the data hierarchy.
Value: Navigate complex activity data without getting lost in nested views. Jump back to any level of the hierarchy instantly—from statement details back to database overview—without clicking the back button repeatedly. The breadcrumb design reduces clicks and cognitive load when drilling into activity details, making your investigation workflows smoother and more efficient.
🔗 Connections Analysis Updates
Connections Overview and Details V2
Improved layout with enhanced connection monitoring capabilities, better filtering options, and clearer data presentation.
Value: Gain better visibility into active connections, connection pooling patterns, and potential connection leaks that could impact performance. The updated interface makes it easier to identify which applications are holding excessive connections, spot unusual connection patterns, or diagnose connection timeout issues. Enhanced filtering and sorting help you quickly find the connections that matter during incident response or performance investigations.
WISdom v25.28.0 - October 29, 2025
AI-Powered Insights and Connected Workflows
This release we're taking AI intelligence to the next level while making your investigation workflows more intuitive. This release introduces machine learning anomaly detection across critical performance areas and creates seamless connections between Activity and Query Statistics, so you can understand the complete story of any performance issue in seconds.
AI-Powered Anomaly Detection
Machine-Learning Anomaly Analysis
Advanced ML-powered anomaly detection now available across Activity Overview, Blocking Overview, and Deadlocks Overview screens.
Value: Automatically identify unusual patterns and performance deviations without manual threshold configuration. Highlight issues by letting AI surface what's truly abnormal in your environment based on historical patterns and behavioral baselines. No more guessing which metrics matter – WISdom learns your environment's normal behavior and flags genuine anomalies.
WISdom Advisor Conversations
Conversational AI Support
Enhanced Advisor now supports interactive conversations for deeper analysis and recommendations. In addition, you can now view/delete past conversations and pick up where you left off in any conversation.
Value: Ask follow-up questions and get contextual guidance directly from WISdom Advisor. Move beyond static recommendations to dynamic problem-solving conversations that help you understand your environments. The Advisor remembers your conversation context, so you can dig deeper into findings without starting over.
Connected Performance Analysis
Activity ↔ Query Statistics Cross-Navigation
Seamless linking between Activity Details and Query Statistics flyouts with "Query History" and "Activity History" buttons that appear when relevant data exists.
Value: Instantly jump from a real-time activity event to its historical query performance patterns, or vice versa. No more manually searching for matching queries across screens – understand the complete story of query behavior from live execution to long-term trends in one click. The buttons only appear when relevant matching data exists, keeping your interface clean while providing powerful navigation when you need it.
Enhanced Activity Flyout
Redesigned with performance metrics and properties tabs integrated from Query Statistics when the query exists in historical data.
Value: See complete query context without leaving the Activity screen. Get historical performance data, execution plans, and optimization opportunities right where you're investigating current activity. The unified flyout eliminates context switching and brings all relevant query information together in one place.
ROI Calculator Fixes
Query Statistics to Calculator Data Flow
Fixed calculation errors and data transfer issues when launching ROI calculator from Query Statistics.
WISdom v25.27.0 - October 2025
Query Analytics Reimagined
This release transforms how you analyze and optimize SQL queries. A completely redesigned Query Statistics experience, enhanced data exports, and smarter navigation mean you'll identify performance bottlenecks faster and take action with greater confidence.
The Bottom Line
WISdom v25.27.0 revolutionizes how you interact with your data. The reimagined Query Statistics screen connects query performance to activity patterns in ways never before possible, while the new WISdom Advisor feature lets you ask questions in plain language and get instant insights. Enhanced exports and streamlined navigation mean less time clicking through screens and more time solving problems. With critical fixes for Azure licensing calculations, alert details, and SSO authentication, you can trust WISdom to deliver accurate insights and reliable access when you need them most.
🤖 NEW: WISdom Advisor
Ask Questions in Plain Language
AI assistant available throughout WISdom
WISdom Advisor is a breakthrough feature that allows you to ask questions using natural, everyday language and instantly receive data-driven insights from across your environment. Simply click the WISdom Advisor button in the upper right corner of any screen, ask your question, and get intelligent answers drawn from WISdom's comprehensive data.
What You Can Ask About:
- Inventory Intelligence - Query hosts, servers, instances, and databases for engine details, machine specifications, cost information, transactions per second, batch requests, and resource utilization
- Storage Analytics - Analyze disk and database file space utilization trends over the last 90 days, including allocated and used space from minute-level, hourly, and daily collections
- Query Performance - Ask about query statistics including cost analysis, execution patterns, and resource consumption
- Blocking Analysis - Investigate all blocking data collected across your environment
- Deadlock Investigation - Explore deadlock occurrences and patterns
How It Works:
- Click the WISdom Advisor button in the upper right corner (available on every screen)
- A chat window opens for your question session
- Type your question in natural language, no special syntax required
- Receive instant answers based on your question
- Each question is independent and does not build on previous answers
- Close the chat window when finished; the session does not persist
Tips for Best Results:
- Be Specific - Ask about specific resources, instances, or databases rather than general questions
- ❌ Vague: "What is blocking?"
- ✅ Specific: "Summarize the blocking in the environment for the past 30 days"
- Define Time Ranges - Specify the time period you want to analyze
- Questions without a defined time range will only analyze the past 2 days
- Examples: "for the past week," "in the last 30 days," "during October"
- Data is available for the past 90 days
- Include Context - Each question is a new session, so include relevant details from previous answers if asking follow-up questions
Usage Limits:
- Each user can ask up to 40 questions per day
- Daily usage resets at midnight UTC
Value: Get answers in seconds that would take minutes of clicking through filters and screens. WISdom Advisor delivers executive summaries of complex performance data across multiple databases or instances instantly, with actionable remediation ideas included in responses. Stop memorizing navigation paths and filter combinations—ask questions the way you think, in plain language, and receive both the data insights and potential solutions to the problems you uncover.
🔍 Query Statistics Reimagined
Complete Query Statistics Redesign
Overview, Details, and Flyout rebuilt from the ground up
The Query Statistics experience has been completely redesigned with a modern layout, improved performance, and enhanced data visualization. The new interface connects query performance data directly to activity patterns, bringing together execution metrics and real-time activity insights in a unified view.
What's New:
- Modern Interface - Streamlined layout designed for how you actually analyze queries
- Activity Integration - Drill into queries to see related activity patterns and execution context
- Enhanced Visualizations - Clearer metrics display with improved charting and data presentation
- Faster Performance - Optimized load times mean less waiting, more analyzing
- Improved Filtering - Find problematic queries faster with enhanced filter options
Value: Analyze query performance more intuitively with clearer metrics, faster load times, and enhanced filtering. Find problematic queries in seconds, not minutes, with a modern interface that connects execution data to activity patterns. The integration between Query Statistics and Activity data eliminates context switching and provides the complete performance picture in one place.
🧭 Streamlined Navigation
Consistent Page Titles
Aligned terminology across the platform
Home page titles now use consistent terminology that matches Query Statistics and other module naming conventions throughout WISdom related to Spend information.
Value: Reduced confusion with consistent naming across the platform. You'll always know where you are and what data you're viewing. Simplified onboarding for new users with unified terminology.
Applications Screen Removal
Deprecated functionality removed
The Applications screen has been removed from WISdom following its deprecation in previous releases.
Value: Cleaner navigation with fewer unused screens cluttering your workflow. A more focused interface that highlights the tools you actually use.
📊 Enhanced Data Export & Analysis
Complete Export Functionality
All column headers and impact values now included
Exports from Blocking Overview, Blocking Details, and Opportunities screens now include all column headers with correct labeling and complete impact values. A bug that caused invalid column headers in exports has been resolved.
Value: Get complete data exports ready for reporting and analysis without manual cleanup or missing critical metrics. Export files now match exactly what you see on screen, eliminating confusion and ensuring data integrity for downstream analysis.
Copy Object Information
One-click clipboard copy for complex object details
Query statements in Blocking and Deadlock flyouts now include a copy button, allowing you to quickly copy complex object names, blocking chains, and related information to your clipboard.
Value: Quickly share blocking chain details with team members or paste into incident tickets without retyping complex object names. Reduce transcription errors and speed up incident documentation.
🏥 Database Health Monitoring
Last Integrity Check Visibility
DBCC CHECKDB tracking and proactive alerts
The Database overview dashboard now displays the date when DBCC CHECKDB was last successfully run for each database, providing immediate visibility into database integrity maintenance status.
New Opportunity Finding:
When an integrity check has not been completed in the past 30 days on a database, it will now appear as a finding on the Opportunities page, listed by instance and database. This proactive identification ensures outdated integrity checks don't go unnoticed.
Value: Immediately spot databases with outdated integrity checks, helping you maintain data reliability and catch potential corruption issues before they escalate. The new Opportunity finding ensures databases without recent integrity checks are flagged for action, transforming passive monitoring into proactive database health management. No more manually tracking when DBCC CHECKDB was last run. WISdom automatically identifies at-risk databases and surfaces them where your team reviews optimization opportunities.
🛠️ Critical Bug Fixes
Azure License Display Fix
Enterprise Azure licenses now count correctly
A new Azure license type for enterprise deployments has been added, and the license count display on the Subscriptions page now accurately reflects the number of licenses consumed for this license type.
Value: Accurate license visibility for proper capacity planning and subscription management in enterprise Azure environments.
Alert Type Details Loading
Suspect database alerts now display complete information
The newly added alerts for databases in a "suspect" state now properly load all data in the Alert Type Details flyout, eliminating blank screens during alert investigation.
Value: Complete alert context when you need it, eliminating frustrating blank screens during incident investigation. Full visibility into suspect database alerts ensures you have the information needed to resolve critical database state issues.
SSO Error Handling
Clearer feedback for authentication issues
Single Sign-On error messages have been improved to provide clear error descriptions and potential solutions when credential or authentication issues occur.
Value: Clearer feedback during authentication problems, reducing login frustration and support escalations. Users now receive actionable guidance to resolve SSO issues without contacting support.
WISdom v25.27.0 is available now – experience query analysis that keeps pace with your expertise.
WISdom v25.26.0 - October 2025
Enhanced Control and Reliability
This release focuses on giving your team more granular control over WISdom while improving data accuracy and user experience. The introduction of the Power User role provides a middle ground between read-only access and full administrative rights, and multiple bug fixes ensure the data you rely on is accurate and consistent.
New Features
👤 Power User Security Role
Streamlined permissions for operational team members
A new Power User security role has been introduced, providing an ideal permission level for team members who need more than read-only access but don't require full administrative control.
Power User Capabilities:
- Create and modify Silencing Windows
- Create and modify Global Views
- Create and modify Global Templates
- Create, modify, and assign Tags
Comparison of Roles:
- User (Read-Only): View data, manage personal My Views and My Templates only
- Power User: All User capabilities plus global configuration management and silencing window control
- Administrator: Full management of all areas in WISdom
Value: This role empowers operational teams to manage day-to-day monitoring configurations and maintenance windows without requiring full admin access, improving security while maintaining efficiency.
Enhancements
🎫 Flexible Ticket Number Format for Silencing Windows
Support for alphanumeric ticketing system references
Silencing Windows now accepts alphanumeric ticket numbers instead of numeric-only values. This enhancement accommodates modern ticketing systems that use alphanumeric identifiers (e.g., INC-12345, TASK-987).
Value: Seamlessly integrate WISdom maintenance windows with your ticketing system's native format, eliminating manual workarounds and improving audit trails.
🔄 Improved Resource Name Caching
Real-time accuracy for Performance Counter instances
The Performance Counter Instance caching mechanism now includes ServerName and provides immediate refresh when resource names are modified.
Value: When you rename servers or instances, the changes are reflected immediately throughout WISdom, eliminating confusion and ensuring your performance monitoring data is always correctly attributed.
💬 Enhanced Error Messaging for Resource Management
Clear guidance when resource operations fail
Error messages for resource management operations have been improved to provide clear explanations and actionable next steps. Two key scenarios now provide specific guidance:
Duplicate Resource Names:
When attempting to create or update a resource with a name that already exists, you'll receive a clear explanation of the conflict and steps to resolve it.
License Allocation Limits:
When resource monitoring cannot be enabled due to license constraints, the following message appears:
"Resource monitoring is currently restricted due to license allocation limits. Please contact WISdomSupport@fortified.com for assistance with your subscription configuration."
Value: Spend less time troubleshooting configuration errors with clear, specific error messages that explain exactly what went wrong and how to resolve it, whether through configuration changes or subscription adjustments.
Bug Fixes
📊 Performance Page Time Range Display
Time range selector now updates correctly
The time range display box on the Performance page now properly updates when a new range is selected, ensuring the displayed timeframe always matches your selection.
🏷️ Complete Tag Availability in Index Statistics
Database-level tags now filter correctly
The Database - Index Statistics screen now properly filters data when database-level tags are selected. Previously, tags assigned only to databases (rather than instances or hosts) would not correctly filter the index statistics data.
Value: Gain consistent filtering behavior across all tag types. Whether you've tagged hosts, instances, or databases, your filters now work reliably to segment and analyze index performance data, making it easier to focus on specific database groups in your environment.
📈 Correct Plot Aggregation for Extended Time Ranges
Accurate data visualization for periods over 7 days
The Aggregation Selection now displays the correct plot aggregate when the time range exceeds 7 days (168 hours). Previously, incorrect aggregation methods were applied to longer time periods.
Value: Trust your long-term performance trend analysis with accurate data aggregation across all time ranges.
🏥 Resource Health Data Accuracy
Complete and accurate host display
The Resource Health screen now displays all hosts correctly and shows accurate health data. An issue causing incomplete host lists and incorrect health metrics has been resolved.
Value: Rely on Resource Health scores to accurately reflect your entire environment's status for confident capacity planning and incident response.
🔧 Performance Counter Metric Instance Reset
Proper behavior when editing counters
When editing an existing performance counter in the Monitoring - Resource screen, the Metric Instance field now resets properly, preventing configuration errors and correctly displaying the updated counter values.
📋 System Alerts Profile Display
Alert list now visible for System Alerts profile
The System Alerts profile now correctly displays its associated alert list, matching the behavior of other profiles.
⚠️ Notification Channel Deletion Confirmation
Prevent accidental deletions
A confirmation window now appears when deleting a notification channel, protecting against accidental removal of critical alerting configurations.
Value: Safeguard your alerting infrastructure with confirmation prompts that prevent unintended deletions.
WISdom v25.26.0 is available now – empowering your team with better control and more reliable data.
WISdom v25.25.1 - September 2025
Reliability and Data Accuracy Improvements
This maintenance release focuses on ensuring data consistency and reliability across WISdom. We've resolved several issues affecting cost reporting accuracy, compliance data aggregation, and database-level filtering to provide you with more dependable insights.
Bug Fixes
🧮 Query Cost Reporting Consistency
Clarified sorting methodology differences between Home Page and Query Statistics
We've resolved data inconsistencies and want to clarify how the Home Page and Query Statistics screens calculate and display Top 10 queries differently:
Home Page - Cost of Code Section:
- Sorts Top 10 statements using multiple columns: Cost, then Compute CPU, then IO
- Displays data based on the last 7 days
- Note: The Home Page time range has been updated from 30 days to 7 days for all scores and calculations
Query Statistics Screen:
- Sorts Top 10 statements by a single column as defined by the selected Pie Chart metric (Cost, CPU, or IO)
- Each metric (Cost, CPU, IO) is sorted and retrieved separately by resource
- Can be filtered to any time range
These different sorting methods and time ranges will generate different Top 10 lists. When comparing the two screens, remember that the Home Page uses a fixed 7-day window, while Query Statistics offers flexible date filtering.
Value: Understanding these methodological differences helps you interpret the data correctly and choose the right view for your analysis needs.
📊 Compliance Connection Summary Accuracy
Fixed data aggregation for Unique Program connections
The Compliance - Connections - Overview screen now correctly aggregates Connection Summary data for Unique Programs. Parent record totals now accurately match the sum of child record data, providing reliable connection analysis.
Value: Accurate connection summaries enable you to trust compliance reporting and make informed decisions about application connectivity patterns.
🏷️ Database Tag Filtering
Database tags now function properly in Activity and Query Statistics
Tags assigned to database objects now work correctly when filtering data in both the Database - Activity and Query Statistics screens. You can now reliably use database-level tags to segment and analyze your workload.
Value: Effective tag filtering lets you quickly focus on specific database groups, improving workflow efficiency and reducing time spent locating relevant data.
WISdom v25.25.0 - September 2025
Quality and Reliability Focused Release
This release prioritizes system reliability and user experience improvements. From enhanced resource management to clearer error messaging, version 25.25.0 eliminates daily frustrations and ensures WISdom works more predictably and intuitively for your monitoring workflows.
🎯 Improved User Experience
Redesigned Resource Health Dashboard
The Resource Health screen has been completely redesigned with a modern, intuitive interface that makes resource monitoring more efficient and actionable.
New Features:
- Health Score Overview Bar: Interactive, quick visual summary showing healthy (green), warning (orange), and critical (red) resource counts at the top. When clicked, automatically applies the Instance drop-down filter for the associated instances
- Resource Performance Comparison Cards: Side-by-side comparison of CPU, Memory, and Storage/IO performance scores for both Hosts and Instances, with clear visual indicators and percentage scores
- Each card has a clickable Hosts or Instances section that displays all the objects related to the card
- Instance Health Dashboard: Comprehensive table view showing both Host Health and Instance Health scores with color-coded status indicators
- Actionable Insights: "Need attention" indicators clearly identify which resources require immediate focus
- Expandable Resource Cards: Clicking on any resource row expands the card to display detailed resource scores for both the Host and Instance for side-by-side comparison
- Drill Through Details: Featuring a Jump To option for each resource via the [View Details] button
- This feature opens the Performance page, loads the selected resource counter for the specified instance or host, displaying the counters driving the score so you can quickly spot the times performance suffers
- Enhanced Visual Design: Clean, modern interface with improved readability and intuitive color coding
Why it matters:
- 🎯 At-a-glance Health Assessment: Instantly see overall system health with the new summary bar
- 📊 Comparative Analysis: Side-by-side performance cards make it easy to compare CPU, memory, and storage metrics
- 🚨 Prioritized Actions: Clear "need attention" callouts help you focus on critical issues first
- 💡 Improved Decision Making: Color-coded health scores provide immediate context for resource status
- ⚡ Faster Troubleshooting: Modern dashboard design reduces time to identify and address performance issues
📅 Notification Channel Scheduling
WISdom now supports schedule templates for notification channels. Create reusable templates that define specific days of the week with start and end times, then apply them to any notification channel. For example, create an "On-Call" template for 10pm-6am, Sunday to Saturday, and apply it to the On-Call team notification channel, or a "Business Hours" template for 9am-5pm weekday channel. Templates control when notifications are sent through each channel and automatically suppress alerts outside the defined schedule.
Why it matters:
- ⏰ Respect Work-Life Balance: Send alerts only during business hours or designated on-call periods
- 🔄 Reusable Templates: Create once, apply to multiple channels for consistent scheduling across teams
- 🚫 Reduce Alert Fatigue: Prevent unnecessary notifications during maintenance windows or off-hours
- 🎯 Targeted Communication: Ensure critical alerts reach the right people at the right time
- ⚡ Simplified Management: Easily modify schedules for multiple channels by updating a single template
Database Size Performance Counters
The Performance screen now includes a new Database Size category with three counters that track allocated database storage: Data Files (MB), Log Files (MB), and Data and Log Files (MB). These counters are collected every minute and can be graphed like all other Performance counters, providing real-time visibility into database storage allocation and growth trends.
Why it matters:
- 📊 Proactive Space Management: Monitor database growth patterns to prevent storage issues
- 📈 Trend Analysis: Track allocation changes over time to plan capacity requirements
- 🔍 Granular Visibility: Separate data and log file tracking for targeted optimization
Enhanced Job Filtering
The Jobs page now includes a Job Status drop-down filter that allows you to filter by enabled jobs or failed jobs based on the last run status. This enhancement makes it easier to quickly identify and focus on problematic SQL Server Agent jobs.
Why it matters:
- 🎯 Focused Troubleshooting: Quickly isolate failed jobs that need attention
- ⚡ Efficient Job Management: Filter on enabled jobs for active job monitoring
- 🔍 Status-Based Analysis: Understand job health patterns at a glance
Database Activity Pressure Indicators
The Activity Overview page now includes Host Pressure and Database Pressure toggles for the Database Activity chart. Database pressure displays by default as a colored overlay, showing periods when Resource Health scores indicate database pressure. Both toggles can be enabled simultaneously with different colors for comprehensive pressure analysis.
Why it matters:
- 🚨 Visual Problem Identification: Instantly see when and where database pressure occurs
- 📊 Correlation Analysis: Connect activity spikes with resource pressure periods
- 🎯 Dual Perspective: View both host-level and database-level pressure simultaneously
- ⚡ Faster Root Cause Analysis: Quickly identify performance bottlenecks during high activity periods
🔔 Important Notification Indicator
A notification indicator and interface has been added to provide notification to Administrators when Critical System alerts have been raised. The notification channel will increment the count and display both the OPEN and CLOSE system alerts. Management of the notifications allow the user to mark them as read or delete the notifications.
Better Activity Monitoring
When wait time shows zero, WISdom now displays a friendly "SQL Query Success" message instead of leaving users wondering if data is missing or if performance is actually optimal.
🚨 Expanded Alert Coverage
WISdom introduces five new alert types to provide comprehensive monitoring across different SQL Server deployment models and critical database states. These customer-requested alerts enhance the platform's ability to detect and notify administrators of issues before they impact operations.
New Alert Types:
- SQL Instance Low Disk Space - Monitors disk space availability for PaaS SQL Server instances
- Azure SQL Database High CPU Usage - Tracks CPU utilization for Azure SQL Database PaaS resources
- High TempDB Version Store Size - Detects excessive TempDB version store growth that can impact performance
- SQL Database is Offline - Alerts when user databases become unavailable
- SQL Database is in an abnormal state - Identifies databases in suspect, recovery pending, recovery, or emergency states
Why it matters:
- ☁️ Cloud and On-Premises Coverage: New PaaS-specific alerts extend monitoring to Azure SQL Database environments
- 🚨 Proactive Issue Detection: Catch database state problems and storage issues before they cause outages
- ⚡ Performance Protection: TempDB monitoring prevents version store bloat from degrading system performance
- 👥 Customer-Driven: These alerts address real-world monitoring gaps identified by WISdom users
- 🏥 Comprehensive Database Health: Monitor critical database availability and operational states
🔧 Enhanced Resource Management
Instance Renaming Now Preserves Historical Data
Instance renaming now preserves all historical data, so when you rename an instance, its collected data history automatically transfers to the new name. This simplified process ensures you don't lose any historical performance information when updating instance names.
Why it matters:
- 📊 Maintain complete performance history during organizational changes
- 🔄 Seamlessly update naming conventions without data loss
- ⚡ Streamlined resource management with confidence
Added Opportunity
SQL Server Standard Edition Resource Overprovisioning Detection
WISdom now automatically identifies SQL Server Standard Edition instances that exceed their licensing resource limits. The new SQL Server Standard Edition Resource Overprovisioning opportunity analyzes allocated CPU and Memory resources against Standard Edition maximum allowances, flagging instances where available resources exceed licensing constraints.
Why it matters:
- 💰 License Compliance: Ensure SQL Server Standard Edition instances operate within licensing limits
- 🎯 Cost Optimization: Identify opportunities to rightsizing resources or upgrade licensing appropriately
- ⚖️ Risk Management: Avoid potential licensing compliance issues through proactive monitoring
- 📊 Resource Efficiency: Better align infrastructure allocation with software licensing capabilities
🐛 Critical Bug Fixes
Alert Information Display
Resolved an issue where some alert information was not displaying correctly, ensuring all critical alert details are always visible when you need them most.
Credential Management
Fixed a bug that prevented creating credentials with dash characters in the name, removing unnecessary restrictions and improving flexibility in credential naming conventions.
Performance Chart Counter Limits
Improved error messaging when exceeding the counter limit on Performance Charts. Users now receive clear guidance instead of ambiguous error messages.
- Error Message Updated: "Too many counters selected. Maximum allowed: 12."
Time Zone Sorting
Time zones in dropdown selectors are now sorted by time offset rather than alphabetically by name, making it much easier to find your local time zone quickly.
ROI Calculator
Fixed an error in the ROI Calculator's Hypothetical Optimization feature that was preventing users from completing cost analysis calculations.
Notification Channel Templates
Resolved an issue where adding a new notification channel schedule template didn't automatically refresh the template list, requiring users to manually reload the page.
🛠️ Behind-the-Scenes Improvements
System Stability
Multiple backend improvements ensure more reliable data collection, processing, and display across all WISdom modules.
Performance Optimizations
Enhanced system responsiveness and reduced loading times for critical monitoring screens.
WISdom v25.25.0 is available now – experience more reliable monitoring with fewer daily frustrations and clearer system insights.
WISdom v25.24.0 - September 2025
Cost Intelligence and Enhanced User Experience
This release delivers powerful new cost analysis capabilities while streamlining your daily workflows. The new ROI Calculator quantifies optimization impact in real dollars, while the redesigned Home Page and modern styling framework make WISdom more intuitive and efficient than ever.
💰 Cost Intelligence Enhancement
Query Optimization ROI Calculator
Make data-driven optimization decisions with quantifiable financial impact analysis. This interactive calculator helps you justify performance tuning investments by showing concrete cost savings, performance gains, and resource reclamation metrics.
Why it matters:
- 💰 Quantify impact - Transform performance improvements into real dollar savings for budget justification
- 🎯 Prioritize efforts - Focus optimization work on queries with the highest financial return
- 📊 Generate reports - Download comprehensive ROI analysis for stakeholder presentations
- ⚙️ Align with business goals - Connect technical improvements to measurable business value
Value: Enables DBAs to demonstrate the financial impact of their work, securing budget approval and resources for optimization projects.
🏠 Enhanced User Experience
Home Page v2
Experience WISdom through a completely redesigned dashboard that puts critical information at your fingertips. The new layout consolidates key performance indicators, cost metrics, and priority alerts into a single, actionable view.
Key Benefits:
- ⚡ Faster decision-making - Centralized KPIs eliminate screen jumping to assess system health
- 🎯 Drill-through capabilities - Click any metric to dive directly into detailed analysis
- 📈 Visual improvements - Modern design with enhanced readability and intuitive navigation
- 🔄 Consistent experience - Seamless integration with existing WISdom workflows
Value: Reduces time spent gathering information across multiple screens, enabling faster response to performance issues and more efficient daily monitoring.
Job Overview v2
Transform job monitoring with an interactive heat map visualization that reveals patterns in SQL Server Agent job execution. Choose between two powerful views: job start times or concurrent job execution, both displayed by hour per day, averaged across your selected time range.
Key Features:
- 🗺️ Interactive Heat Map - Visual representation of job activity patterns across days and hours
- ⏰ Dual View Options - Toggle between job start times and concurrent execution analysis
- 🎯 Click-to-drill - Click any day/hour cell to open a detailed investigation filtered to that specific timeframe
- 📊 Pattern Recognition - Easily identify job clustering, resource contention periods, and scheduling gaps
- 🔍 Enhanced Details Flyout - Comprehensive job analysis with organized tabs:
- Job Configuration - Complete job setup details and schedule(s)
- Performance Statistics - Execution times, success rates, and historical trends
- Job Steps - A list of all steps with related details to each step
Why it matters:
- ⚡ Spot bottlenecks instantly - Identify peak execution periods that may cause resource contention
- 📅 Optimize scheduling - Redistribute jobs to balance system load throughout the day
- 🔧 Faster troubleshooting - Visual patterns plus detailed step analysis accelerate problem resolution
- 📈 Capacity planning - Understand job execution trends to plan for future growth
- 🛠️ Complete job visibility - From high-level patterns to granular step-by-step execution analysis
Value: Proactive job monitoring with visual pattern recognition and comprehensive detail analysis reduces system downtime, improves resource utilization, and enables data-driven job scheduling optimization with faster issue resolution.
New Styling Framework
WISdom is modernizing the interface with a consistent design language across the platform, providing a better visual hierarchy, improved readability, and more intuitive navigation patterns.
Enhancement highlights:
- 🎨 Modern UI - Contemporary design elements that reduce visual fatigue
- 📱 Better accessibility - Improved contrast and semantic markup for all users
- 🔄 Consistent patterns - Standardized interactions reduce learning curve
- ⚡ Performance optimized - Faster loading and smoother interactions
Value: Improved user adoption and reduced training time through more intuitive interface design.
🔧 Enhanced Management & Monitoring
Enhanced Silencing Window Management
Streamline alert management with the ability to clone existing silencing windows and granular permissions control. New features include:
- Clone functionality - Duplicate existing configurations to speed setup
- Advanced permissions - Granular control over notification management
- Profile-based defaults - Consistent alert thresholds across similar environments
Value: Reduces alert fatigue through more efficient notification management and consistent alerting standards.
Activity Compare Enhancements
Enhance cross-environment analysis by displaying Instance Name and Hostname in configuration exports, facilitating more precise identification of database instances during comparative analysis.
Value: More precise reporting and better identification of performance differences across environments.
Audit Events Pagination
Navigate large audit logs more efficiently with improved pagination, reducing load times and providing better performance when reviewing compliance data.
Value: Faster compliance reporting and improved system performance when working with large audit datasets.
🛠️ Critical Reliability Improvements
Data Export & Visualization
- Fixed Activity Compare Top Statements export functionality - reliable data export for analysis
- Corrected color matching issues in Activity Compare screens - consistent visual representation
- Enhanced data mapping safety checks in Alerts Overview - improved monitoring reliability
User Interface Stability
- Resolved Opportunity screen reload issues when opening and closing the details flyout for smoother navigation
- Fixed unexpected screen refreshes, providing a more predictable user experience
- Improved Alert Type checkbox interactions, allowing a click on the box or the name, creating a more reliable profile configuration
Authentication & Security
- Fixed SSO credential update errors, resulting in dependable single sign-on functionality
- Enhanced monitoring system stability and more consistent alert management capabilities
The Bottom Line
WISdom v25.24.0 transforms performance optimization from gut instinct to data-driven decision making. The ROI Calculator provides the financial justification needed to secure optimization resources, while the redesigned interface eliminates daily workflow friction. Enhanced reliability ensures you can trust WISdom to deliver consistent insights when you need them most.
Total Enhancements: 18 features and fixes
- New Features: 3 major capabilities, including ROI Calculator and Home Page redesign
- Enhanced Features: 6 workflow improvements for better efficiency
- Bug Fixes: 10 critical stability and reliability improvements
WISdom v25.24.0 is available now – experience smarter cost intelligence with enhanced workflow efficiency.
WISdom v25.23.0 - August 2025
Enhanced User Experience and Streamlined Workflows
This release continues our commitment to user-centric improvements with enhanced filtering capabilities, simplified navigation, and critical bug fixes that restore expected functionality. New user notifications keep you informed, while improved integration management and better data visualization tools help you work more efficiently across the platform.
🔔 User Notifications System
New User Notifications Framework
WISdom now includes a comprehensive user notification system that keeps you informed about important system events and updates in real-time. This proactive communication system reduces the need to manually check for system status changes and ensures you never miss critical information.
Why it matters:
- ⚡ Stay informed - Real-time alerts about system events keep you up-to-date without constant monitoring
- 🎯 Reduce oversight - Proactive notifications prevent missing important system changes
- 🔄 Improve workflow - Less time spent checking system status means more time solving problems
- 📢 Enhanced visibility - Critical system information delivered directly to you when it matters most
🔧 Enhanced Management
Integrations
Streamlined API Keys Interface
We've updated the API keys interface, moving the API Keys to the Integrations page. This allows the API keys to integrate seamlessly with the existing integrations UI, providing a consistent experience across all integration management tasks.
Value: Simplifies API key management with familiar interface patterns, reducing the learning curve and streamlining integration setup workflows.
Enterprise Admin
Jump To: Collector Health in Enterprise Admin
Customer-requested feature - Added a "Jump To: Collector Health" option to the Enterprise Admin action menu, allowing MSP customers to view all client-related health information and quickly jump to the Collector Health page for the specific client.
Value: Significantly reduces time spent navigating between screens for troubleshooting and provides quick access to detailed collector error information for faster issue resolution.
🔍 Advanced Filtering Capabilities
Enhanced Filtering with a Connecting Host option
- Blocking Screens - Connecting Host filtering is now available on blocking screens
- Activity Page - Connecting Host filtering was added to the Activity - Overview page
Value: Enables targeted analysis by isolating the data display for specific connecting hosts, reducing data noise, and improving troubleshooting efficiency during performance investigations.
Impact Category Filtering
A new filtering option by Impact category in the Opportunities section allows you to prioritize optimization efforts based on potential business impact.
Value: Focus on high-impact opportunities first, improving decision-making for resource allocation and optimization planning.
📊 Improved Data Visualization
Enhanced Resource Health and Inventory Screens: Smarter, More Personalized Data Viewing
We’ve upgraded Inventory and Resource Health Screens to deliver a more intuitive and responsive experience. You can now:
- Customize column widths, allowing you to quickly view longer object names.
- Choose which columns to display using the action icon on the table, and select which columns to display on the selected page.
- Enjoy persistent settings; your layout preferences are saved in the browser cache, so they remain intact as you navigate between screens.
These enhancements empower you to customize your workspace for greater efficiency and clarity, helping you focus on the data that matters most.
Enhanced Database Metrics Granularity
The Database Allocation over Time and Databases Annual Data Growth cards in the Environment - Instance and Database pages now offer more granular insights. Selecting the Full Screen option or using the new View Daily button allows the user to see the sizes recorded daily instead of monthly.
Value: Better capacity planning with detailed growth patterns, improved trend analysis accuracy, and more informed strategic planning for database infrastructure.
Sorted Database Lists
Database lists in the Availability Groups page can now be sorted for improved navigation and organization.
Value: Reduces time spent searching for specific databases in large environments and provides consistent data organization across the platform.
🪟 Better User Experience
Improved Notifications Messages
Redesigned flyout notifications for success and errors that no longer display in front of or behind informational flyouts. This provides a cleaner, non-intrusive feedback during task completion.
Value: Eliminates workflow disruption, improves productivity, and provides a seamless user experience during operations.
🛠️ Critical Bug Fixes
Client Administrator Permissions Restored
Customer-submitted - Client Administrator accounts can now properly save Account page changes, restoring expected role-based functionality.
Recurring Silencing Windows
Customer-submitted - The day of the month selection now properly prepopulates in recurring silencing window flyouts, eliminating manual re-entry and reducing configuration errors.
Updated Host Count Display
The Instance - Overview now correctly displays actual host counts when available. When the data is not available, instead of displaying "0" when no hosts are present, N/A will be displayed instead, providing a clear message related to why the data is not displayed.
Reliable Filter Functionality
Tag filters are now impacted by the reset button, by clearing all tag filters, ensuring consistent and predictable filtering behavior when applying new filters.
The Bottom Line
WISdom v25.23.0 eliminates daily workflow friction while adding powerful new capabilities. Enhanced filtering, streamlined navigation, and proactive notifications mean less time managing the tool and more time optimizing your environment. With critical permissions restored and improved data accuracy, you can trust WISdom to deliver reliable insights when you need them most.
Total Enhancements: 16 features and fixes
- New Features: 2
- Enhanced Features: 9
- Bug Fixes: 5
Customer-Driven: 3 items directly address customer-submitted requests, demonstrating our commitment to responsive development.
WISdom v25.23.0 is available now – experience smarter monitoring with fewer interruptions.
WISdom v25.22.0 - August 2025
Cost Intelligence and Enhanced Data Management
This release prioritizes cost visibility while enhancing data management for greater intuitiveness. New cost insights, improved filtering capabilities, and customizable, default views mean you can optimize performance and spending with greater precision and less administrative overhead.
💰 Cost Intelligence Enhancement
Wait Time Custom Cost Basis - We’ve introduced a new custom cost management option that allows you to define a cost basis for queries experiencing wait time. This feature enables you to assign an hourly rate to all wait events in your environment, configurable via the Cost Management screen.
Why it matters:
- 💰 Quantify the impact of wait time in real dollars, helping prioritize performance tuning efforts.
- 🔮 Enable future cost-based insights, such as the financial impact of blocking and other wait-related inefficiencies.
- ⚙️ Aligns with cost-aware performance management, giving teams a clearer picture of where optimization delivers the most value.
This is a foundational step toward more advanced wait cost analytics coming soon to WISdom.
🔎 Enhanced Filtering and Search
Tags filter for Alert Types - A Dropdown filter has been added to the Alert Types screen for tag-based filtering. Value: Rapidly filter alerts by tags to find relevant alert configurations without scrolling through long lists.
SQL Statement sorting - The option to sort by individual SQL statements has been removed due to limitations in consistently sorting across all statement variations. Instead, we utilize a more powerful alternative: Group By: SQL Statement. This will provide aggregates of the execution data for identical SQL statements in a consolidated, more insightful view of performance metrics. By grouping executions, developers and DBAs can more easily identify high-impact queries and analyze trends across workloads, without the noise of minor statement variations. Improving clarity, scalability, and the overall value of performance analysis in WISdom.
📊 Improved Data Visibility
Collector Version Display - The UI now displays collector metadata information in the Admin Console - Collections screen, specifically installation date and version. Value: Know when a data collector was installed and configured to work in WISdom and quickly verify collector versions for troubleshooting, ensuring you're running the latest data collection capabilities!
🪟 Better User Experience
Default Views Functionality – Streamline Your WISdom Experience
WISdom now allows you to configure a custom default view that applies across all screens. This feature ensures that data for your most critical environments or targets is always front and center, without the need to manually apply filters each time.
Key Benefits:
- ⚡ Faster access to high-priority data across the platform
- 🔁 Consistent visibility into key environments, regardless of screen or workflow
- 🛠️ Reduced setup time, thanks to prepopulated filters tailored to your needs
This enhancement helps teams stay focused on what matters most, improving efficiency and reducing friction in daily operations.
Enhanced error handling - Improved 404 response handling and "No Client Data" scenarios. Value: Clearer guidance when data isn't available, reducing confusion and support requests by providing a link to possible solutions.
WISdom v25.22.0 is available now – plan for deeper cost insights while working more efficiently.
WISdom v25.21.0 - July 2025
Performance, Reliability, and New Integrations
WISdom v25.21.0 is here, delivering the performance, reliability, and integrations you've been asking for. Whether you're monitoring in real time, managing enterprise environments, or streamlining incident response, this release makes WISdom faster, smarter, and easier to use—so your team can focus on what matters most.
🚀 Real-Time Monitoring Revolution
Auto-Refresh for Key Dashboards
Stay up-to-date without lifting a finger. The new auto-refresh switch is now available on:
- Alerts Overview
- Activity Overview
- Performance Overview
- Resource Health Overview
Designed for Network Operations Centers and real-time monitoring scenarios, dashboards now refresh automatically every 60 seconds by default. Need more control? Choose 5- or 15-minute intervals to suit your workflow. This eliminates manual refreshes and ensures you’re always working with the latest data—critical during incident response and performance troubleshooting.
💬 Slack Integration for Seamless Workflows
Instant Alerts Where Your Team Works
WISdom now integrates directly with Slack as a ticketing provider. Configure alerts to post directly into your Slack channels, so your team stays informed without switching tools. This integration:
- Reduces alert fatigue by centralizing notifications
- Speeds up incident response
- Keeps your team aligned in real time
Setup is simple—just head to the Admin Console > Integrations page to connect your Slack workspace.
⚙️ Enhanced Performance & Reliability
We’ve made several key updates to improve the usability, accuracy, and reliability of WISdom’s core features:
#### 🎭Smarter Metric Selection on the Performance Screen
The Performance screen now intelligently prompts users to select a metric instance when multiple instances are available. This enhancement prevents confusion caused by blank or incomplete results and ensures that users always see relevant, actionable performance data.
#### 📑Improved Table Export Functionality
Exported tables now fully respect your applied search and filter criteria. This means you’ll receive exactly the subset of data you’ve curated—making it easier to generate precise, tailored reports without additional cleanup or filtering outside the platform.
#### ⬆️Accurate Sorting on Security Accounts Compliance Screen
We’ve resolved an issue with column sorting on the Security Accounts compliance screen. Sorting now functions correctly across all columns, allowing users to quickly locate specific accounts or compliance issues with confidence and efficiency.
🏢 Improved Enterprise Management
Streamlined Multi-Tenant Workflows
Enterprise Admins and MSPs benefit from:
- Reliable export functionality in Enterprise Overview
- More intuitive multi-account management
- Cleaner workflows for managing complex environments
These updates simplify administration and improve visibility across large-scale deployments.
🛠️ Behind-the-Scenes Improvements
Modernized UI & Architecture
We’ve upgraded several foundational components:
- Standardized tab layouts
- Cleaner CSS architecture
- Updated Elastic.js libraries
- Refined opportunity management workflows
These technical enhancements result in faster load times, smoother interactions, and improved browser compatibility—making daily monitoring more efficient and reliable.
WISdom v25.21.0 is available now.
Experience smarter monitoring, faster workflows, and more reliable performance—built to keep your operations ahead of the curve.
June 2025 - v25.20.0
WISdom v25.20.0: Enhanced User Experience and Streamlined Workflows
We're continuing to refine WISdom based on your feedback, making the platform more intuitive and powerful for daily database management tasks.
The Bottom Line
This release eliminates daily frustrations and accelerates your workflow. Clearer data visibility, simplified navigation, and smarter alert management mean less time fighting the tool and more time solving problems.
Never lose track of critical error messages again. With extended visibility and the ability to copy error IDs before they disappear, you’ll have the information needed to collaborate effectively with support. Say goodbye to the frustration of vanishing errors. Plus, enjoy a refreshed, modern interface that’s easier on the eyes and simpler to navigate.
Featuring:
- ⏱️ Extended error message display (15 seconds) with an instant acknowledgment option
- 🎨 Modernized UI styling for a cleaner, more intuitive user experience
Spot memory-hungry queries causing contention in seconds with new size range filters. Compare performance periods with crystal-clear "Baseline vs Comparison" labeling instead of confusing time period numbers. See complete server specs (CPU, Memory, Cores) organized logically.
Featuring:
- 🧠 New Memory Grants filtering drop-down in Activity Overview with size range options from Minimal (0–8 MB) to Extra Large (2 GB+)
- 📊 Improved Activity Compare screen with intuitive "Baseline" vs "Comparison" labels and smart defaults
- 🖥️ Enhanced Inventory Hosts with added CPU Cores and reorganized data ordering (CPU, Memory, Cores)
- ⚠️ Consolidated Instances and Hosts filtering on the Monitoring Alerts screen into a Resources drop-down filter that contains both an Instance and Host expander.
Quickly analyze and understand index behavior with powerful new filtering and display enhancements. Instantly distinguish between heap, clustered, and non-clustered indexes. Hover to reveal full index names with copy functionality, and enjoy a cleaner, more responsive layout. Identify unused indexes at a glance with the new "Never Been Used" tag in the Last Read metric.
Featuring:
- 🔍 Advanced filtering by Primary Key and Index Type
- 📈 Detailed usage metrics including Seeks, Scans, Lookups, and Updates per day
- 🕒 Last Read metric now shows either the last access time or a "Never Been Used" tag
- 🛠️ Visibility into the last user-initiated update that triggered index maintenance
- 🧩 Improved table layout with better column resizing and semi-bold headers for clarity
Note: Index statistics are collected on a weekly basis.
Managed Service Providers (MSPs) can now oversee all client environments from a single, unified dashboard. The new Enterprise Admin view consolidates subscription data, health scores, and optimization metrics—eliminating the need to toggle between screens. Alert management is now safer and more transparent, with real-time previews of additions and deletions before changes are committed.
Featuring:
- 📊 Enterprise Overview dashboard for MSPs, replacing the former MSP Admin view
- Summarizes total Opportunities, Active Licenses, Query Cost Optimization data, and Health Scores
- Provides a centralized view of all managed environments
- 🔔 Alert Type Change Tracking with confirmation dialogs
- Preview all alert additions and deletions before saving
- Reduces risk of accidental changes and improves auditability
WISdom v25.20.0 is available now – work smarter, not harder.
June 2025 - v25.19.0
We are thrilled to announce the release of WISdom v25.19.0! This update introduces Silencing Windows for alerts, a robust new feature that now enables users the option to suppress specific alerts for a define time, thereby reducing noise and enhancing alert management.
Key enhancements include improved organization of templates on the Performance page, new groupings for views, enhanced management of custom tolerances for alerts, the ability to create profiles at the MSP level that may be pushed to all child accounts, and smarter tag filtering, all designed to make WISdom more intuitive and efficient than ever.
In addition to these exciting enhancements, several bug fixes have also been implemented to further improve the user experience.
New Features
Silencing Windows
We are pleased to announce an update to the Silencing Windows feature in WISdom, which enhances its functionality for more precise alert management. Users can now define a silencing window for specific alerts across selected resources, or opt to silence all alerts by not selecting any specific alerts when needed.
The new feature in the creation of a window includes:
-
New Alert Type Tab: When creating or editing a Silencing Window, a new tab has been added alongside the existing Settings and Resources tabs.
- Silencing Windows can now be defined for specific alerts. This allows users to tailor their silencing strategy based on the alerts that need to be managed during maintenance or to reduce noise.
-
Familiar Setup Process: The process for building Silencing Windows remains consistent. Users can still select the time or duration of the window and choose which resources will be impacted. The new Alert Type tab simply adds an extra layer of customization when needed, but not required.
This enhancement provides users with greater flexibility and control when managing alerts, making it easier to perform maintenance tasks or quiet down alerts during specific timeframes.
Enhancements
Templates - Performance Page
The Templates on the Performance screen within the Monitoring module have been enhanced. They are now organized into three distinct groups: My Templates, Global Templates, and WISdom Templates, each serving a unique purpose.
-
WISdom Templates are system-generated and cannot be edited. However, they can be loaded, updated, and saved as either a Global Template or a My Template.
-
My Template refers to a template created and saved by a user without designating it as a global template. This template will be accessible only within the user's defined client account.
-
Global Template is a template created by a user in a specific client account and designated as global by selecting the Set as Global Template switch. This template will then be available to all users with access to that client account.
Views
The Views available on most WISdom pages have been enhanced with new Groupings. Similar to the Performance Templates, Views can now be categorized as either a My View or a Global View.
-
My View refers to a view that a user has saved for reuse, which is accessible only within their specific client account.
-
Global View is a view created by a user that has been designated as global by selecting the Set as Global View switch. This makes the view available to all users with access to the client account.
Alert Types
The Alert Types page in the Monitoring section of the Admin Console has been enhanced to allow users to add multiple custom tolerances while in Edit mode. Users can now click the [+ tolerance] button multiple times to add a new tolerance for each click.
Each newly added tolerance can be individually defined and customized according to specific requirements. After all desired tolerances have been added and defined, users must select the master [Save] button at the bottom of the Edit Alert Type page to apply the changes to the alert. This update provides greater flexibility in managing alert tolerances and improves the overall user experience.
Alert Types in Profiles
The advanced mode in the Alert Types screen has been enhanced
The Alert Type within the Profile section has been updated to improve the user interface and overall experience by creating a more intuitive and efficient experience when managing alerts within WISdom.
Key updates include:
-
Streamlined Display for Single-Level Alerts: Alerts with only one level will now be displayed on a single line without the use of an accordion, consolidating and simplifying the view, allowing for more data to be displayed on the page.
-
Removal of Level Count: The red badge indicating the level count has been removed from the Level column and moved to the Alert Type column for a cleaner appearance.
-
Default Selections: Resources and Alert Types will now be unchecked by default, allowing users to make selections more intentionally.
-
Expanded Multi-Level Alerts: Alerts with multiple levels will be expanded by default, providing immediate visibility into their details.
-
New Default Severity Column: A Default Severity column has been added to the Alert selection, enhancing clarity on alert priorities.
-
Improved Resource and Alert Type Selections: The layout of the Resources and Alert Type selections has been enhanced. The second column has been moved to the left, and names will be truncated when necessary, with full names available on hover for better usability.
Profiles - MSP Specific
The Profiles section in the Monitoring area of the Admin Console has been enhanced for MSP clients. When creating a new Profile, MSP Admins will now find an additional switch in the New Profile - Details flyout. This feature enables MSP Admins to establish a profile at the MSP account level, which can then be applied across all child accounts within the MSP structure.
Tags
We are pleased to announce an enhancement to the Tags drop-down filter in WISdom. The filter has been updated to display only the tags relevant to the current page, rather than showing all tags created for the client account.
This improvement provides users with an optimized view of the tags available on the currently displayed page, streamlining the tagging process and enhancing overall usability.
Bug Fixes
Teams - Bulk Edit
The bulk edit feature on the Teams page of the Admin Console has been updated. When users are being bulk edited and the Deactivate option is selected, the pop-up window now correctly displays a [Deactivate] button instead of a [Delete] button.
Profiles
WISdom Profiles can now be deleted. To successfully delete a profile, users must first remove all associated resources from that profile. Once all resources have been cleared, a trash can icon will appear on the Profile row, allowing users to remove the profile easily. This enhancement streamlines profile management and provides greater flexibility in organizing client account settings.
Team
The Team page has been updated to restore the ability to sort all columns in the Team Members table. Users can now easily organize and view team member information according to their preferences.
Weekday Filter
The Weekday drop-down filter has been updated to display the days of the week in the order of Sunday through Saturday.
Blocking Details
The Blocker ID used to identify a group of blocking statements has been updated to remove the comma on the details page. This change aligns the format of the Blocker ID with how it is displayed on the Overview and in the Details flyout.
Jobs
The legend displayed on both the Daily and Hourly Snapshot graphs has been corrected to accurately reflect the appropriate information at the bottom of the graphs.
June 2025 - v25.18.0
We are excited to announce the introduction of two new features in WISdom, along with multiple bug fixes. The Alerting module has added an escalation feature to the alerting family, and the Performance page now offers Templates, allowing users to save frequently used counters and charts for future use.
New Features
Alert Escalation
We are excited to introduce the Alert Escalation feature in the Alerting module of WISdom. This enhancement provides an easy-to-configure alert escalation system that integrates seamlessly with ticketing systems, as well as email and text notifications.
Alert escalation can be set up in the Profiles page within the Monitoring section of the Admin Console. When creating a new Profile or managing an existing one, users will find the Alerts section now defaults to a Basic editor, which mirrors the previous alert configuration display. However, to set up an alert for escalation, users must switch to the new Advanced editor. Once an alert in a Profile is configured with an escalation, the Advanced editor will be activated, and the Basic editor will be disabled for the Profile. All alert escalations will still apply any exception rule defined for the Alert Type.
Setting Up an Escalation
To set up an escalation, open the Advanced editor in the Alerts section of the Profile editor. The new interface will display a row for each Alert Type, with a corresponding row below, labeled Level 1, that shows both the Severity and Tolerance defined for the alert and the Object(s) when available. Users can click the vertical ellipses at the end of the row to access the [+ Add Level] option, allowing them to add subsequent escalation levels, starting with Level 2.
Each added escalation level must have a lower tolerance setting than the previous one, with options for standard tolerances (Low, Medium, High) or custom settings defined in the Alert Types screen. Notifications will be sent based on the Severity assigned to each level, and while the same severity can be used across levels, it is recommended to assign higher severities for notifications sent through various channels defined in the Notifications section of the Profile Editor.
This new feature enhances the flexibility and responsiveness of alert management, ensuring that critical issues are addressed promptly through effective escalation strategies.
Performance Screen Update
The Performance screen now includes a template feature! This new feature allows users to save and easily reuse templates, significantly reducing the time and effort needed to create Performance Charts.
Templates can be customized to include selected metrics without being tied to a specific instance or host, or they can be tailored to specific Hosts or Instances along with frequently used metrics. Additionally, system templates will be available, focusing on metrics related to the Resource Health scores and other commonly requested metrics. This enhancement aims to streamline the performance monitoring process and improve user efficiency.
Enhancements
Activity Screen - Wait Based Activity Chart
A new chart has been introduced on the Activity page within the Database module. Users can now switch from the Database Activity graph to a Wait Activity bar chart, which displays the duration of waits in minutes across various wait categories. This new view provides a visual representation of wait times, enabling users to easily identify periods of high wait activity and the specific types of waits being experienced, with each wait category defined by its associated color.
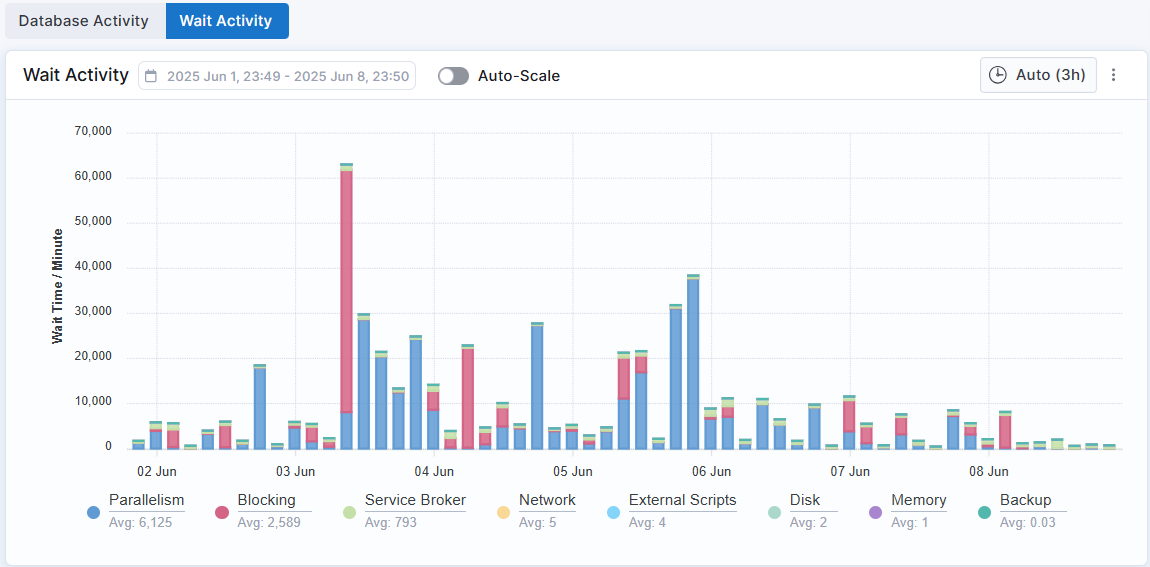
Filters
The drop-down filters in WISdom have undergone updates and enhancements. Some filters that were not applicable to certain pages have been removed, while new filters have been added to improve the overall filtering capabilities. Additionally, the options within the filters have been refined to enhance the user experience.
For instance, the Data Collector filter on the Resources page in the Collection section of the Admin Console now includes an [Unassigned] option. Furthermore, all filter options now feature an exclusion function, allowing users to exclude objects based on their selected filters. These improvements aim to provide a more efficient and effective filtering experience.
Integrations
WISdom now offers integration with the Jira ticketing system, enhancing your workflow and issue management capabilities.
With this feature, you can easily send alerts in WISdom to Jira to create tickets, ensuring that all relevant information is readily accessible when an alert resolves, a closed notification is sent to Jira, resulting in the ticket being closed or resolved in the Jira system. This seamless connection between WISdom and Jira helps improve collaboration among teams and ensures that critical issues are managed efficiently.
To set up the integration, navigate to the Admin Console and follow the configuration steps outlined in the integration settings. This enhancement aims to improve your team's productivity and response times when managing alerts and incidents.
Bugs
Alert Rules
When configuring a new Alert Rule with the behavior set to "Ignore Alert," you can now save the configuration without needing to define a tolerance setting.
Filters
Selected filters are now displayed below the drop-down selectors, allowing for easy viewing of all selected filters and their removal.
Blocking Details Flyout
Long Instance names displayed in the properties box of the Blocking Details flyout are now word-wrapped, improving the overall visual presentation.
Picture of Page Download
The Download PNG and Download PDF functionality has been restored on all screens when selecting the vertical ellipses in the top right corner of a page in WISdom.
Opportunities Export
The export feature for an Opportunity has been updated to export all the records related to the opportunity selected.
Alerts - Profile Page
Clicking on the Resources, Alert Type, or Notification icons on the Profile page opens a pop-up that now enables navigation between multiple pages of data when available.
Environment - Hosts Filtering
The Host filter has been enabled and now filters accordingly.
Home Page - Resource Information
The informational pop-up that appears when clicking the [i] icon for the Performance card has been updated to display the correct time ranges for each optimization level.