Jobs – Overview
The Jobs Overview screen displays SQL Server Agent Job information for all Instances defined by the filters. The page contains three main sections: a chart displaying the times and counts of jobs running, high-level analytics information, and activity details. This screen also provides Slicers for further filtering. (Slicers may be collapsed on the right side of the screen, see the Slicers section of the User Guide for information on functionality)
The results displayed on the screen can be filtered with the drop-down filters consisting of Instance, Category, Name, and/or Tag.
Time Series / Daily Snapshot / Hourly Snapshot
This card contains visualization of the number of job execution events over time.
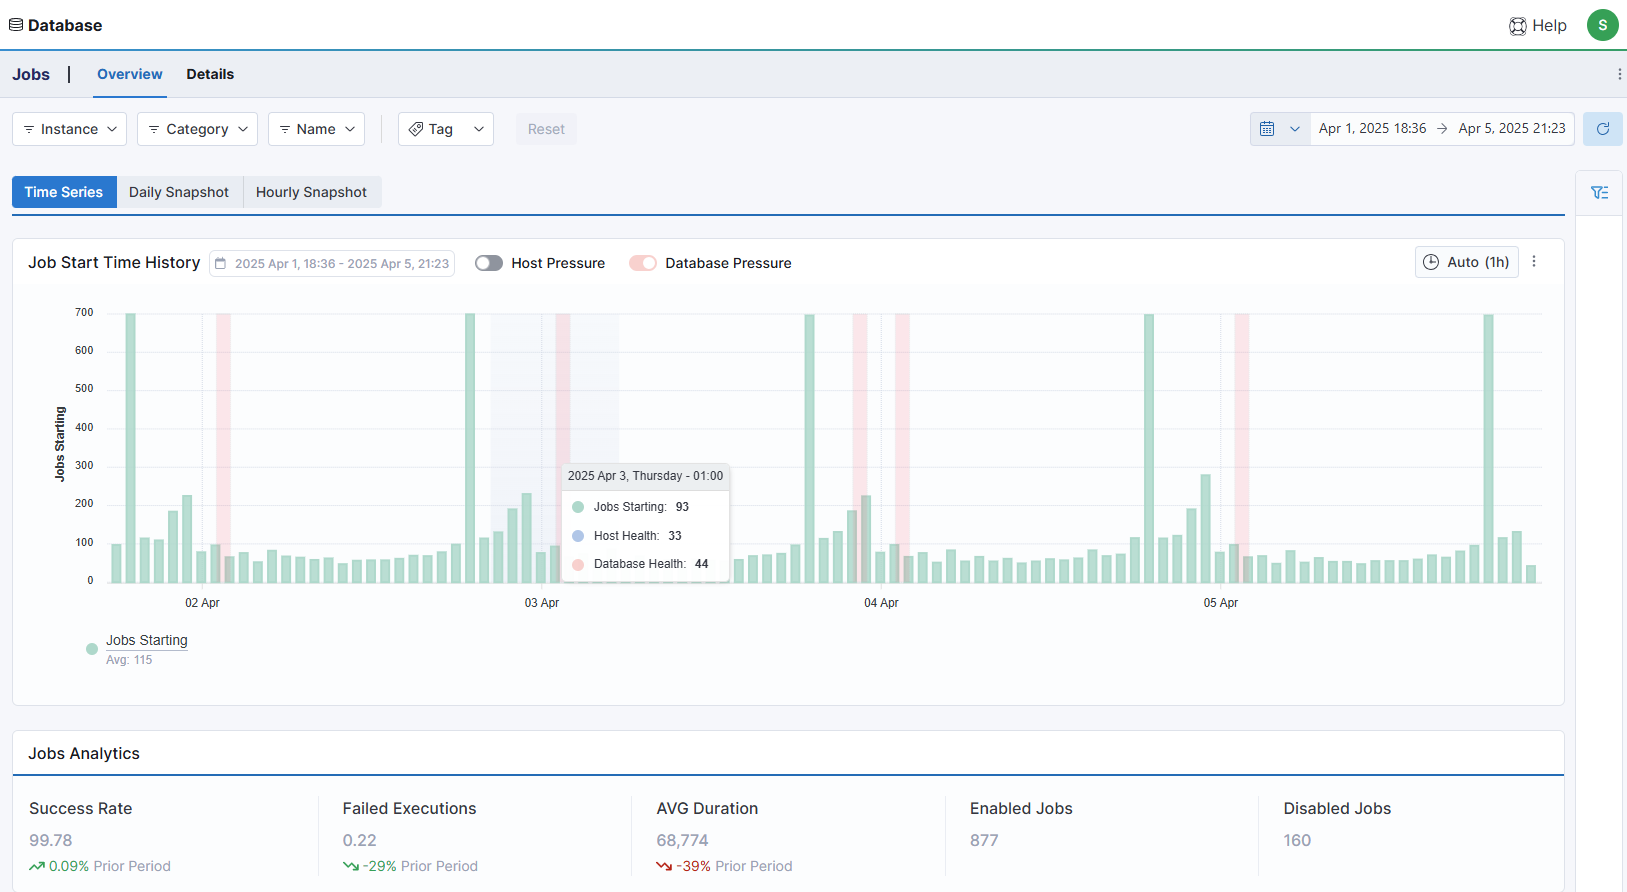
This chart has three modes: Time Series, Daily Snapshot, and Hourly Snapshot. All three will provide bar charts showing the number of jobs starting on the instance(s) chronologically, totaled by hour of the day, or totaled by minutes of the hour respectively. Time Series can also provide overlays for Host and Database Pressure for correlation. The selected date range is displayed in the header at the top of the chart. The Daily and Hourly Snapshot views are an excellent way to identify days or times concurrently scheduled events - adjusting these schedules may help in reducing pressure on the servers.
To examine the job events, the visual display can be adjusted as follows:
- Use the calendar widget to change the date range (default is last seven (7) days). The selected range is displayed on the card tool bar.
- Use the time widget to change the time interval displayed (Auto is one (1) hour).
- Use the slide toggles to filter the Time Series display to add or remove Host and Database Pressure shading.
- Use the Instance, Database, Blocker ID, Weekday, Time of Day and/or Tag filters.
- Click and drag the cursor across the chart to narrow the time range for the selected period.
The data displayed in the Events Count and Unique Blocking Chains cards can also be further focused using Slicers.
Jobs Analytics
This card displays summary data for all of the job executions with start times in the selected range according to the filters applied.
This card is organized into the following segments:
- Success Rate displays the percentage of all executions for the period that completed successfully.
- Failed Executions displays the percentage of all executions for the period that failed.
- AVG Duration displays the average duration in milliseconds for all executions during the period.
- Enabled Jobs displays the number of jobs that are enabled on the selected instance(s).
- Disabled Jobs displays the number of jobs that are disabled on the selected instance(s).
Activity Details
This card displays blocking chain data that can be used to further examine blocking events. WISdom aggregates blocking events in Blocks by Chain by the combination of Instance, Database, Lead Blocker, and Object (if applicable). This means that the same SQL statement blocking traffic against the same object will be grouped together by default, enabling the user to see the highest-impact or most frequent points of contention across the enterprise. Each is given a unique Blocker ID.
Blocks by Chain Results are grouped in a searchable table format with sortable columns, as follows:
- The Blocker ID column displays the unique identifier for that blocking chain.
- The Instance column displays the name of the instance where the blocking occurred.
- The Database column displays the name of the database where the blocking occurred.
- The Object column displays the object the lead blocker's statement is a part of.
- The SQL Statement column displays the SQL statement responsible for the blocking.
- The Blocking Impact column displays the cumulative wait time across all blocked victims for this Blocker ID.
- The Blocking Events column displays the number of times this blocking event occurred in the selected time range.
- The Blocked Victims column displays the total count of blocked SPIDs for this Blocker ID.
Note: Click the column headings to sort the list in ascending or descending order.
Click 3-DOT icon at the right in any row to view additional blocking chain details. See the View Details section for more information.
Blocking chain data can be further focused by using the Group By drop-down menu, as follows.
- By Blocker ID: Displays a sortable list by Blocker ID, Blocking Impact, Blocking Events, and Blocked Victims.
- Click the arrow [>] to the left of the row to display Blocker information by Instance, Database, Object, Lead Blocker, Blocking Impact, Blocking Events, and Blocked Victims.
- By Instance: Displays a sortable list by Instance, Blocking Impact, Blocking Events, and Blocked Victims.
- Click the arrow [>] to the left of the row to display Blocker information by Instance, Database, Object, Lead Blocker, Blocking Impact, Blocking Events, and Blocked Victims.
- By Database: Displays a sortable list by Database, Blocking Impact, Blocking Events, and Blocked Victims.
- Click the arrow [>] to the left of the row to display Blocker information by Blocker ID, Instance, Object, Lead Blocker, Blocking Impact, Blocking Events, and Blocked Victims.
- By Object: Displays a sortable list by Object, Blocking Impact, Blocking Events, and Blocked Victims.
- Click the arrow [>] to the left of the row to display Blocker information by Blocker ID, Instance, Database, Lead Blocker, Blocking Impact, Blocking Events, and Blocked Victims.
- By Lead Blocker: Displays a sortable list by Lead Blocker, Blocking Impact, Blocking Events, and Blocked Victims.
- Click the arrow [>] to the left of the row to display Blocker information by Blocker ID, Instance, Database, Object, Blocking Impact, Blocking Events, and Blocked Victims.
Blocks by Object
Switching to Blocks by Object pivots the data to group by Table (default), Instance, Database, Schema, or Index ID via the Group-By drop-down menu.
Results are grouped in a searchable table format with sortable columns, as follows:
- The first column will display the Table, Instance, Database, Schema, or Index ID as selected in the Group-By menu.
- Blocks displays the count of blocking events on that object.
- Block Wait Time displays the total blocking wait time for that object.
- Page Wait Time displays the sum of all wait time for that object for page locks.
- Row Wait Time displays the sum of all wait time for that object for row locks.
Each of these rows will also have the arrow [>] to drill down for more details.
To View Blocking Details:
Click the 3-DOT icon at the end of a row to view blocking details. See the Blocking – Details section for more information.