Activity
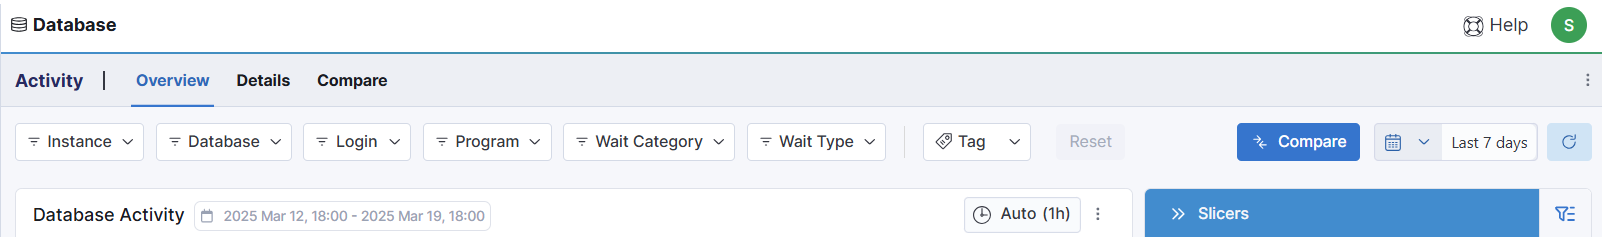
This module contains information related to database activity. Use the drop-down filters (shown below) to refine the data being displayed. The filter options are Instance, Database, Login, Program, Wait Category, and Tag.
For additional filtering of the data, Slicers may be used. See the Slicers section for more information on their use.
The Activity Module contains three tabs: Overview, Details, and Compare.
Overview
Provides a high-level view of database activity during the defined time range, including Blocking, Running Processes, and aggregations of SQL Statements executed.
Details
Provides the ability to drill-down into smaller time ranges (3 hours to 1 minute) and view the query execution information for a specific Instance. Additional filters may be applied to further refine the data.
Compare
Provides comparisons of Activity and Configuration to highlight differences in running queries, query performance, and/or configuration values.