Activity Compare
The Activity Compare screen allows the comparison of activity and configuration for one or two instances for two time periods. The comparison focuses on finding differences in configuration and/or anomalies in the workload. Workload anomalies are defined as time intervals with more than X% (configurable) difference in running queries sampled during that time window.
Comparison Settings
There are several information cards, but the Compare screen begins with entering values into the Comparison Settings card.
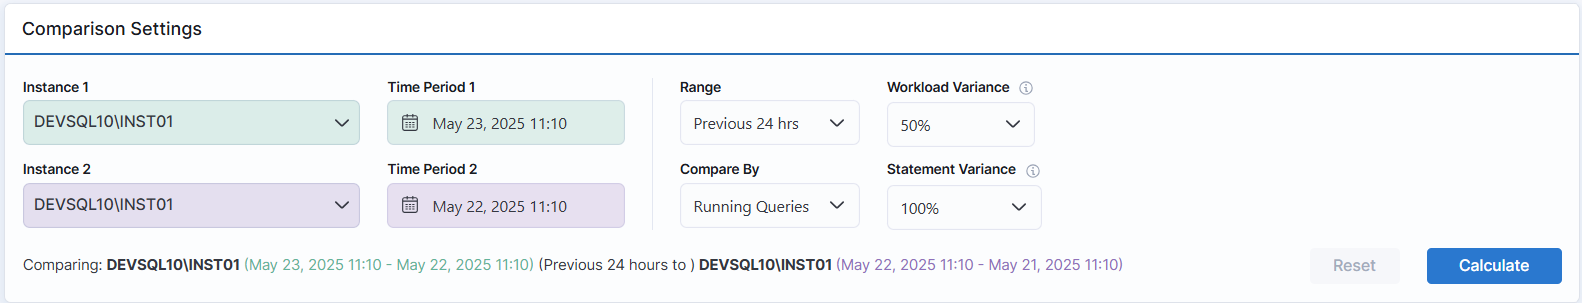
There are a number of options on this card:
- The Instance widget allows selection of the instance(s) for comparison.
- The Time Period widgets control the END date and time for each time range.
- The Range selector allows the selection of 24, 12, 6, 3, or 1 hour windows for comparison.
- Compare By sets the comparison metric from a selection of Running Queries, CPU, Wait Time, or IO.
- The Workload Variance selector sets the anomaly threshold for the comparison. The results displayed will include any workload variance that exceeds your selection.
- This will influence the data that appears in the Database Activity and Top Events cards.
- Statement Variance sets a variance percentage to compare running queries, showing results with a variance greater than the selected percentage, with options ranging from 100% to 10,000%.
Comparison Results
This card displays summary information about the comparison.
- Instance Configurations displays the number of configuration differences detected.
- Time Periods Exceeding the Variance displays the number of time intervals with workload anomalies in excess of the configured threshold.
- Percentage of Activity Exceeding the Variance shows the average of the variance across the time periods flagged as anomalies.
Instance Properties
This card shows the configuration differences between the time range(s) and instance(s) by default. If the Show All switch is toggled it will show all configuration values compared, whether or not they are different.
- The Scope column shows the level at which the configuration resides such as Instance, Host, or Operating System.
- The Category column will display Configuration, Infrastructure, or Setup to further point to where that configuration option resides.
- The Property column displays the name of the configuration.
- The Time Period 1/2 Value columns display the value in use for that configuration at that time on that instance.
Click on the column headings to sort the list in ascending or descending order.
Database Activity
This card displays a graph of the count of running queries for each time period over the X-axis of the selected time range.
- The graph will be shaded gray for the anomaly periods.
- Hover the cursor over the graph to see the counts of running queries for that time interval.
- To concentrate the display on a specific time range, left click and drag the cursor over the display to select the block of time. The histogram will display only that period.
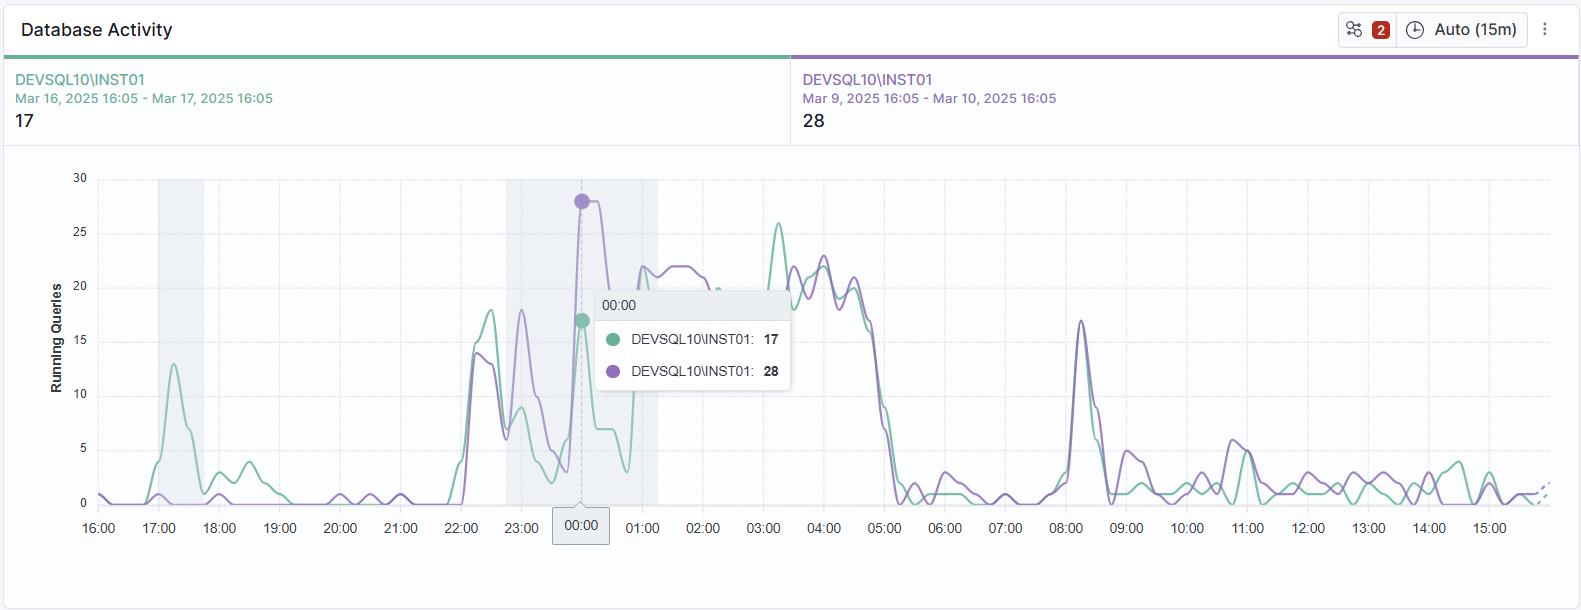
At the top-right of the card there is an Anomalies button and a Time Widget
- Click on the Anomalies button to see the Activity Anomalies pop-up which will display a row for each interval with the variance as a percentage and the counts of running queries for each interval.
- Use the time widget to change the time interval displayed (Auto is 15 minute intervals).
Top Events
This card displays the SQL Statement, Variance, Running Queries, Wait Time, CPU, IO, and Observations (Wait Categories) for each statement that had a variance during the selected period in a searchable table format with sortable columns.
- To examine the two time periods information for a query, click on the arrow > to the left of the row to select.