WISdom is a Workload analysis tool. Resource Health Scores simplify the process of identifying resource pressure on CPU, Memory, Storage or Contention for Windows Servers and SQL Server Instances.
Overview
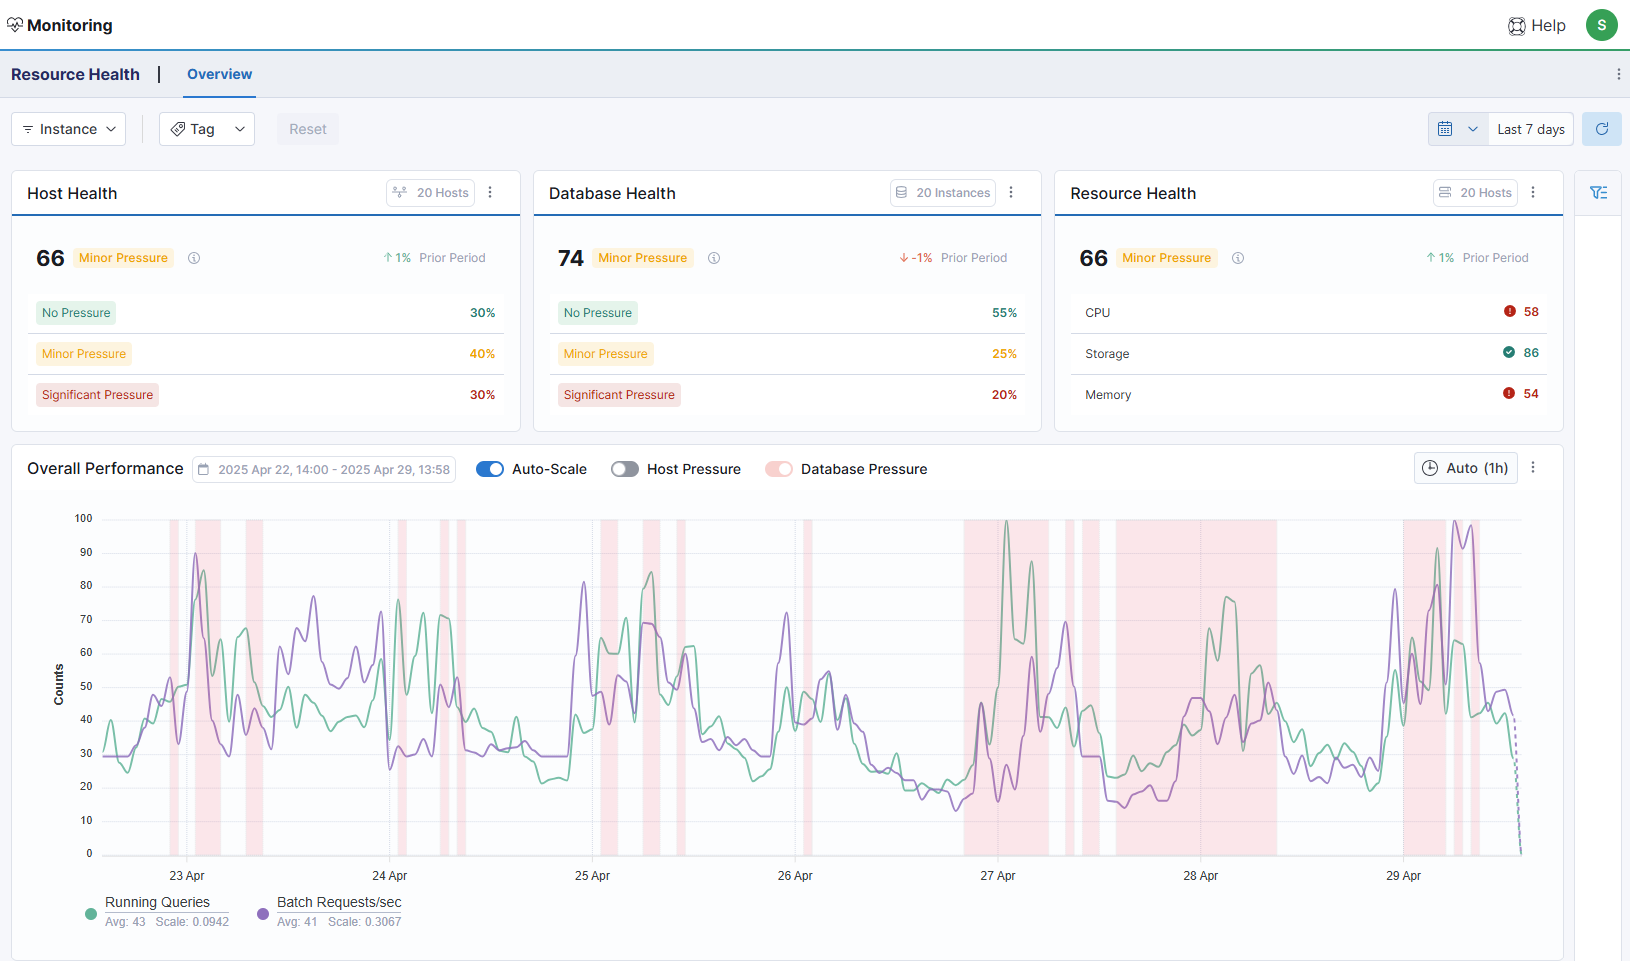
Advanced analytics and algorithms are used to categorize and identify resource pressure on CPU, Memory, Storage or Contention for Windows Servers and SQL Server instances. The following cards are used to display data on the health and capacity of a server or application resource at any time:
- Host Health
- Database Health
- Resource Health
- Overall Performance
- Instance Health
Impact on performance (load) can be analyzed based on increases or decreases in the workload. Resources being consumed within the database systems are tracked and bottlenecks are identified. They are divided between Host, Database, and Resource levels, and given a numeric Health Score and a qualitative Workload Impact.
The Health Score represents the utilization and pressure on resources at that level. A value of 100 indicates that there is excess capacity to spare or even no real workload. As utilization increases, the health score will decrease. Values between 99 and 75 indicate that those resources are being increasingly utilized as score decreases but things are running optimally, values from 74-60 indicate minimal spare capacity, and values under 60 indicate increasing bottlenecks and likely user-visible performance impacts. See the Health Score section for more details.
Workload Impact tracks the amount of time the system is spending under degraded performance conditions. "No Workload Impact" means that less than 5% of the selected time range was spent under significant pressure, "Minor Workload Impact" will display when 5-25% of the time was spent under pressure, and "Major Workload Impact" will appear when the system sees degraded performance more than 25% of the time.
Resources are grouped into three Categories at the host level, and a fourth, Contention is added to the Database level:
- CPU
- Memory
- Storage
- Contention is focused on the incidence of Blocking and Deadlocks.
Use the drop-down filters to focus the data displayed by Environment and Instance. Double-click the selection to exclude specific filters (displays an “X” in the drop-down). Resource information is updated to reflect the filters selected. Click the RESET button to clear the filters.
- For additional data filters, Slicers are provided. See the Slicers section for more information on focusing the data in the displays.
Slicers
To filter the data in the dashboard displays, click the Slicer icon [ ///] to the right of the Overall Performance card. Selections made in the Slicers are reflected in the Filters drop-downs at the top of the screen. The Slicer panel includes filters for:
- Host by Impact
- This slicer displays a sortable list of all Hosts by Host Breakouts in descending order.
- Instances by Impact
- This slicer displays a sortable list of all Instances by Database Breakouts in descending order.
- Instances by Running Processes
- This slicer displays a sortable list of all Instances by Counts in descending order.
- Instances by Batch Requests
- This slicer displays a sortable list of all Instances with Avg and Max values in descending order.
Host Health
This card provides the Health Scores for the Hosts being monitored by Health Status. The total number is displayed in the card header and indicates that there are multiple Instances for single Hosts. The average percentage during the current date range is compared to the prior period.
- To view the individual scores of each Host at that status, click the row.
- Click the 3-DOT icon to display the comparisons in full screen format. To display a single, selected Host only, click the Host name and select the expand filter (expand/collapse/copy). The dashboard displays will reflect this selection.
Database Health
This card provides the Health Scores for the Databases being monitored by Health Status. The total number is displayed in the card header. The average percentage during the current date range is compared to the prior period.
- To view the individual scores of each Database at that status, click the row.
- Click the 3-DOT icon to display the comparisons in full screen format. To examine a single, selected Instance only, click the Instance name and select the expand filter (expand/collapse/copy). The dashboard displays will reflect this selection.
Resource Health
This card lists the CPU, Storage, and Memory Health Scores for the Hosts being monitored. The total number is displayed in the card header. The combination of CPU, Storage, and Memory scores determines the overall Resource Health Score.
- To view the individual CPU, Storage, and Memory resource scores for each Host, click the row. A sortable list of Hosts and Scores is displayed in a pop-up.
- Click the 3-DOT icon to display the resource scores in full screen format. To examine a single, selected Host only, click the Host name and select the expand filter (expand/collapse/copy). The dashboard displays will reflect this selection.
Overall Performance
The color-coded stacked lines of the Overall Performance histogram displays the number of Running Processes, and Batch Requests that fall within the specified range of time with shaded overlays for periods of Host and/or Database Pressure. The selected date range is displayed in the header of the Overall Performance card.
To examine the performance of individual elements of the system, the focus of the visual display can be changed, as follows:
- Use the calendar widget to change the date range (default is last seven (7) days). The selected range is displayed on the card tool bar.
- Use the time widget to change the time interval displayed (Auto is one (1) hour).
- Use the slide toggles to filter the display by hiding or showing the plot lines and shading for Host Health, Database Health, Running Processes, and Batch Requests.
- Use the Environment and Instance drop-down Filters to change the visualization. Depending on the filter(s) selected, the histogram will display the overall performance for that criteria.
Instance Health
This card groups results for Instance, Host Health, Running Processes, Batch Requests. Host Breakouts, Database Health, and Database Breakouts in a searchable table format with sortable columns, as follows:
- The Instance column displays the names of installations of SQL Servers stored in the database environment during the specified range of time.
- The Running Processes column displays the number of running queries detected during the specified range of time.
- The Batch Requests column displays the number of SQL batch requests per second the server received during the specified time range.
- The Host Health column combines the averages of the CPU, Storage, and Memory Health Scores.
- The Host Impact column displays the host-level Workload Impact description for that time period.
- The Database Health column combines the averages of the Contention (total number of Blocking and Deadlock events), CPU, Storage, and Memory Health Scores.
- The Database Impact column displays the database-level Workload Impact description for that time period.
The Hover the cursor over the column headings to sort the list in ascending or descending order.
To view the Host Resource and Database Resource Scores for a particular Instance, click the arrow [>] to the left of the row. Resource details are displayed in two cards by Host and Database and will show the individual Health Score and Workload Impact for each resource.
Resource Health data can be further focused by using the Group By drop-down menu to group by Time Frame:
This option displays a sortable list of the overall Host and Database Health by Time Frames. Use the Chart Interval widget to further focus the Time Frames.
- The Host Health, Running Processes, Batch Requests. Host Breakouts, Database Health, and Database Breakouts are displayed for each time range.
- To examine the specifics for a particular Instance, click the arrow [>] to the left of the row to select. The Host Resource Scores and Database Resource Scores for only that Instance will be listed by Resource, Health, and Workload Impact.
- To filter the displays to show only that Time Frame, click the [d] arrow to the right of the Time Frame field and click the Expand icon. To return the displays to the default results, click the Collapse icon or the RESET button.