Deadlocks – Overview
The Deadlocks Overview screen displays results for all instances and/or databases defined by the filters. The page contains three main sections Events Count, Deadlock Groups, and the Slicers. (Slicers may be collapsed on the right side of the screen, see the Slicers section of the User Guide for information on functionality)
The results displayed on the screen can be filtered with the drop-down filters consisting of Instance, Database, Weekday, Time of Day and/or Tag.
Deadlock Events
This card contains visualization of the number of deadlock events over time.
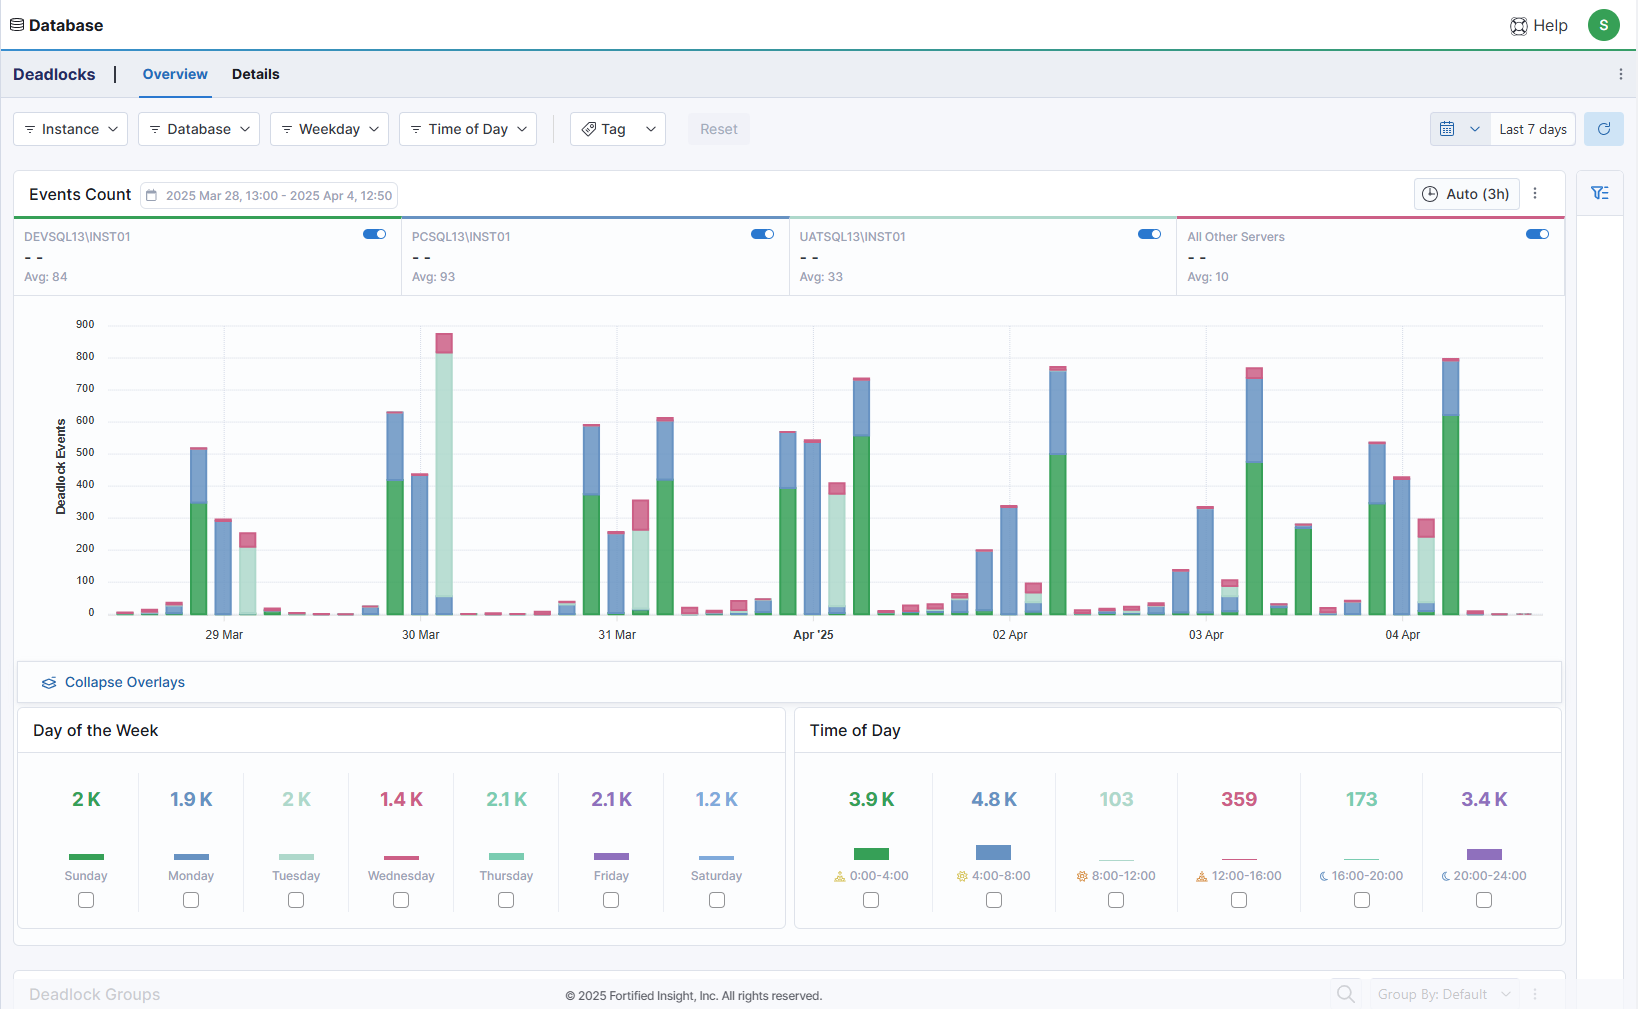
The color-coded stacked lines of the Deadlocks Events Count histogram displays the top three Instances by count of blocking events that fall within the specified range of time along with a bar for the sum of all other servers. The selected date range is displayed beside the Events Count header at the top of the chart.
To examine individual blocking events, the visual display can be adjusted as follows:
- Use the calendar widget to change the date range (default is last seven (7) days). The selected range is displayed on the card tool bar.
- Use the time widget to change the time interval displayed (Auto is one (1) hour).
- Use the slide toggles to filter the display by hiding or showing top Instance(s).
- Use the Instance, Database, Weekday, Time of Day and/or Tag filters.
- Click and drag the cursor across the chart to narrow the time range for the selected period.
The data displayed in the Events Count card can also be further focused using Slicers or by the checkboxes in the Day of the Week and Time of Day cards below the chart. These cards break down the events in the chart by day of the week and time ranges.
Deadlock Groups
This card displays deadlock group data that can be used to further examine deadlock events. WISdom aggregates blocking events in Deadlock Groups where the Deadlock XML file references the same code, lock types, and resources for the same Instance and Database. The timings of the events might differ slightly, but the deadlock diagram for any of those events would look identical. This enables the user to see the highest-impact or most frequent points of contention across the enterprise and prioritize solutions accordingly. Each is given a unique Deadlock Group ID.
Deadlock Groups Results are grouped in a searchable table format with sortable columns, as follows:
- The Deadlock Group ID column displays the unique identifier for that deadlock group.
- The Instance column displays the name of the instance where the blocking occurred.
- The Database column displays the name of the database where the blocking occurred.
- The Deadlock Events column displays the number of times this deadlock event occurred in the selected time range.
- The First Date column displays the earliest occurrence of that deadlock within the selected time range.
- The Last Date column displays the earliest occurrence of that deadlock within the selected time range.
Note: Click the column headings to sort the list in ascending or descending order.
Click 3-DOT icon at the right in any row to view additional deadlock group details. See the View Details section for more information.
Deadlock Group data can be further focused by using the Group By drop-down menu, as follows.
- By Instance: Displays a sortable list by Instance, Deadlock Events, First Date, and Last Date.
- Click the arrow [>] to the left of the row to display Deadlock information by Deadlock Group ID, Database, Deadlock Events, First Date, and Last Date.
- By Database: Displays a sortable list by Database, Deadlock Events, First Date, and Last Date.
- Click the arrow [>] to the left of the row to display Blocker information by Deadlock Group ID, Instance, Deadlock Events, First Date, and Last Date.
To View Deadlocks Details:
Click the 3-DOT icon at the end of a row to view Deadlocks Details. See the Details - Deadlocks section for more information.