Alerts fire when specific events occur or when a specified performance threshold is reached. The following cards display information on the configured Alerts that have fired within the specified time range.
- Use the calendar widget to change the date range (default is last seven (7) days).
Alerts can be further filtered by Host, Instance, Alert Category, Severity, Alert, Alert Status, and Tag using the drop-down filters at the top of the screen.
Overview
The Overview screen is made up of four cards: Top Alerts by Severity, Top Alert Categories, Top Resources, and Top Alerts.
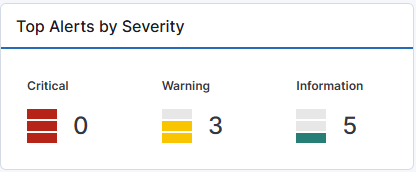
Top Alerts by Severity
This card displays alert counts for the selected time range by the severity associated with the alerts. Click on any severity to filter the view for only that severity.
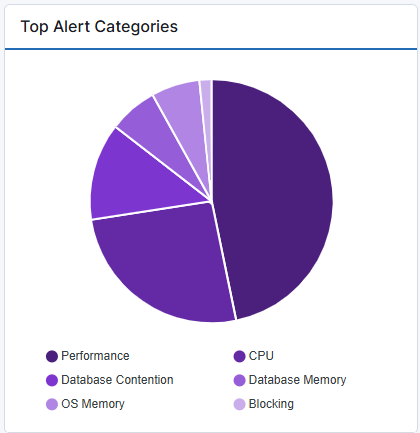
Top Alert Categories
This card displays alert counts for the selected time range by the categories associated with the alerts. Alerts are grouped into categories based on the problem or resource bottleneck they represent for identification of larger trends or issues.
Top Resources
This card presents a tabular view of the alerts and their severities for your top Resources (Hosts and Instances). These are sorted by default in descending Critical Alert quantity but can be sorted by any column by clicking on the headings. The columns include the Resource Name along with Critical, Warning, and Information alert counts for that resource.
- Click on the three-dot action icon at the end of a row to view the Alerts Details screen for that resource.
Top Alerts
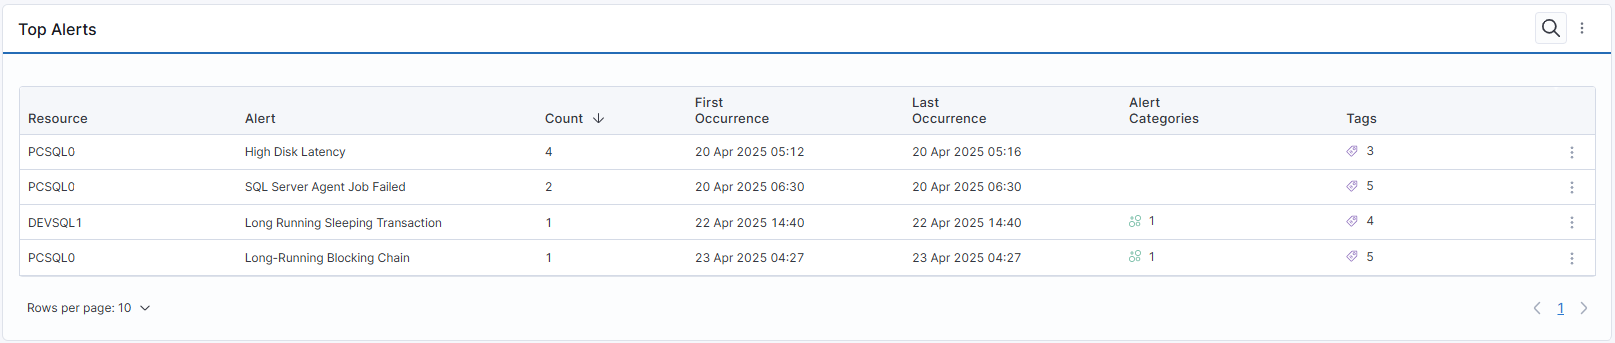
This card lists the result count for the Top Alerts in descending order in a table format, as follows:
-
The Resource column displays the resource name.
-
The Alert column displays the name of the alert.
-
The Count column displays the count of that alert for that resource for the selected time range.
-
The First Occurrence column displays the first occurrence of that alert for that resource within the selected time range.
-
The Last Occurrence column displays the last occurrence of that alert for that resource within the selected time range.
-
The Alert Categories column displays the alert categories (if any) that the alert belongs to.
-
The Tags column displays the tags associated with the resource.
-
Click on the three-dot action icon at the end of a row to view the Alerts Details screen for that resource.