The Overview screen displays information on the activity pattern on one or more instances as well as the Top Events collected from them. The data is split into Database Activity and Top Events cards with the usual filters and slicers available.
Database Activity
The histogram provides an aggregated distribution of data over the defined time range. The number of running processes and blocking events that fall within the specified range of time are displayed. Additionally, filters provide ways to view the SQL Statements being run at the time of collection and further examine any performance issues in the underlying system code.
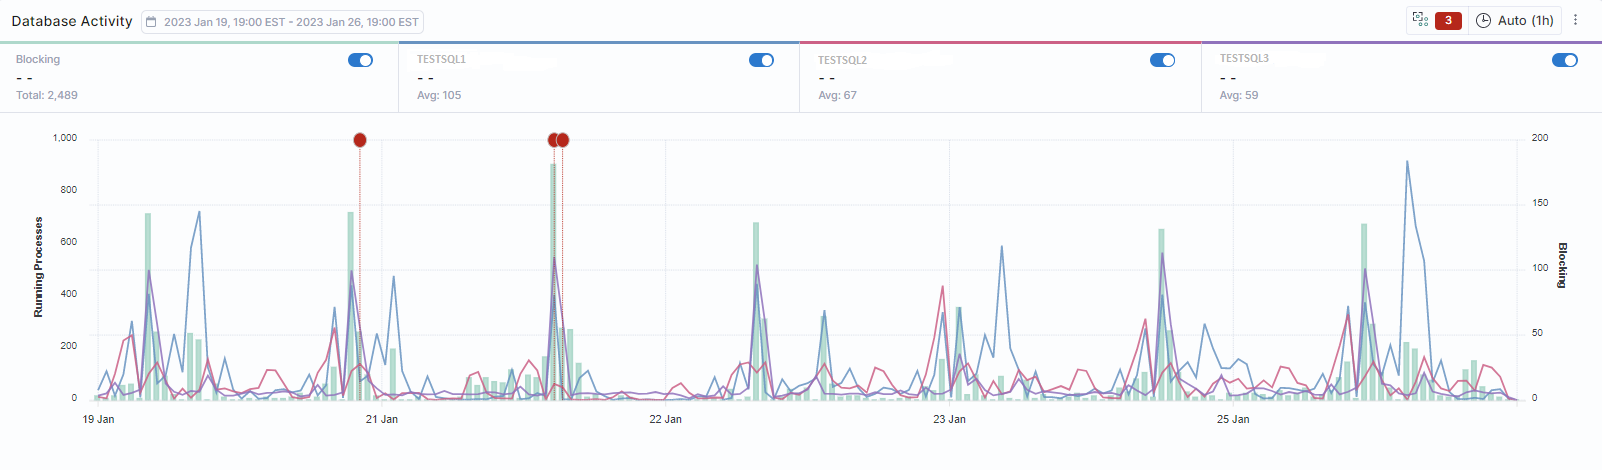
The color-coded stacked lines plot the performance trends on a server level for the top three (3) instances within the selected date range. To examine the performance of individual Instances, the visual display can be changed to further identify which processes are putting computing or memory pressure on the system, as follows:
-
Use the calendar widget to change the date range (default is last seven (7) days). The selected range is displayed on the card tool bar.
-
Use the time widget to change the time interval displayed (Auto is one (1) hour).
-
Use the slide toggles to filter the display by either blocking events and/or top instance(s).
-
Use the Instance, Database, Login, Program, Wait Category, and Tag drop-down filters to change the visualization. Depending on the filter(s) selected, the histogram will display the top three instances for those criteria.
-
To highlight data points, hover the cursor over the stacked, color-coded lines. The marker pop-up will display the number of running process and blocking events by date and time for the selected Instance(s). These values are also displayed below the slide toggles along with totals and averages based on percentage contribution.
-
To concentrate the display on a specific time range, left click and drag the cursor over the display to select the block of time. The histogram will display only that period.
Top Events
This card groups result-sets for Counts of Running Queries, Wait Time , CPU, and Logical Reads in a searchable table format with sortable columns that can be grouped by Instance, Database, and SQL Statement.
- Click on the column headings to sort the list in ascending or descending order.
Database performance on the code level can be further examined by using the Group By drop-down menu, as follows:
By Instance:
Displays a sortable list by Instance of the Counts, Wait Time, CPU, and Logical Reads resource metrics.
- To examine the resource metrics for a particular Instance, click the arrow > to the left of the row to select. The resource metrics for only that Instance will be listed by Database and SQL Statement.
- To view the performance metrics for any of the databases listed, click on the row to display the Activity Details Flyout.
By Database:
Displays a sortable list of resource metrics by database, including Counts, Wait Time, CPU, and Logical Reads.
- To examine the resource metrics for a specific instance of a database, click the arrow > to the left of the row. This will display the resource metrics for that instance, organized by Database and SQL Statement.
- To view the performance metrics for any listed database, click on the row to open the Activity Details flyout.
By SQL Statement:
Displays a list of SQL Statements grouped across all database servers by Counts, Wait Time, CPU, and Logical Reads resource metrics.
- Hover the cursor over the column headings to sort the list in ascending or descending order.
- To view a list of the Instances using a particular SQL Statement, click on the arrow > to the left of the row to select. The resource metrics for those Instances will be listed by Instance and Database.
- To display additional information about the SQL Statement, click the row in the Instances list to display the corresponding Activity Details flyout.
Wait Activity
The top chart card can be switched from Database Activity to Wait Activity. This mode will chart the waits in minutes by category over time, enabling users to easily identify periods of high wait activity and the specific types of waits being experienced, with each wait category defined by its associated color.
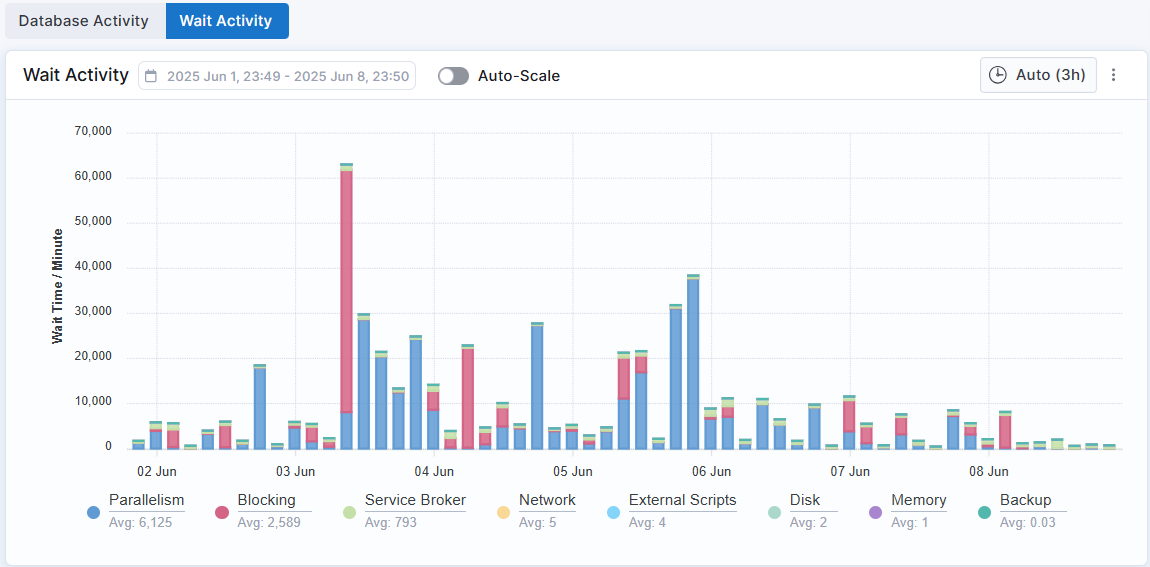
Waits can be added or removed from the chart by clicking on the legend items at the bottom of the chart.
:::