This screen displays information about all Data Collectors configured and enabled in a client environment. Each card presents a unique perspective on the data, with the Status by Data Collector table being interactive, allowing users to drill down into any errors encountered by a specific Data Collector.
System Status
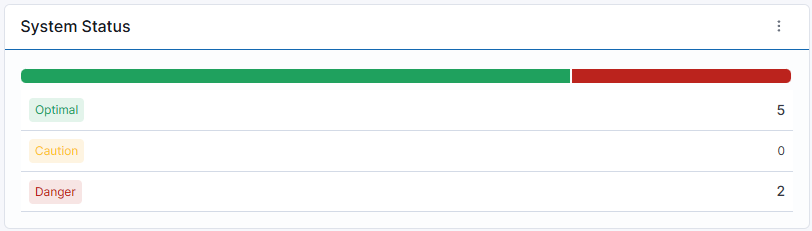
The System Status card provides a high-level overview of the health status for the WISdom data collector service(s). The color-coded bar at the top of the card represents the statuses as a percentage. Collection issues are tracked, ranked, and assigned a System Status as follows:
-
Optimal: Indicates that the service(s) are successfully collecting, processing, and transferring data.
-
Caution: Indicates that one or more service(s) are experiencing issues that may result in some data not being collected or uploaded to the Fortified WISdom Cloud.
-
Danger: Indicates a higher number of serious collection errors, increased latency, or a lack of communication to the Fortified WISdom Cloud.
To view detailed information, click on the number in the System Status row. A pop-up will appear, displaying the Client, Environment, and Status related to that entry.
Collection Status
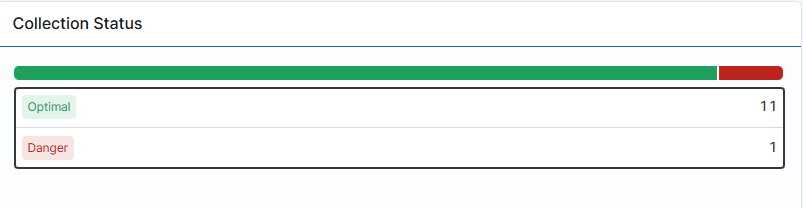
The Collection Status card provides insights into the data collection process from the monitored resources assigned to the service(s). The status is determined by any issues encountered by the collection service. The color-coded bar at the top of the card represents the statuses as a percentage. Collection issues are tracked, ranked, and assigned a Collector Status as follows:
-
Optimal: Indicates that data is being successfully collected for an object, and data files are being created for upload.
-
Caution: Indicates that one or more objects are experiencing issues collecting all data.
- Some data may be collected, while other data may not be collected, resulting in a partial error rather than a full error.
-
Danger: Indicates collection errors for an object.
- Errors in this category are often more detailed and typically point to permissions and/or access issues for data collection service accessing the monitored hosts and instances.
- These errors can be viewed in the Status by Data Collector section.
Status by Data Collector
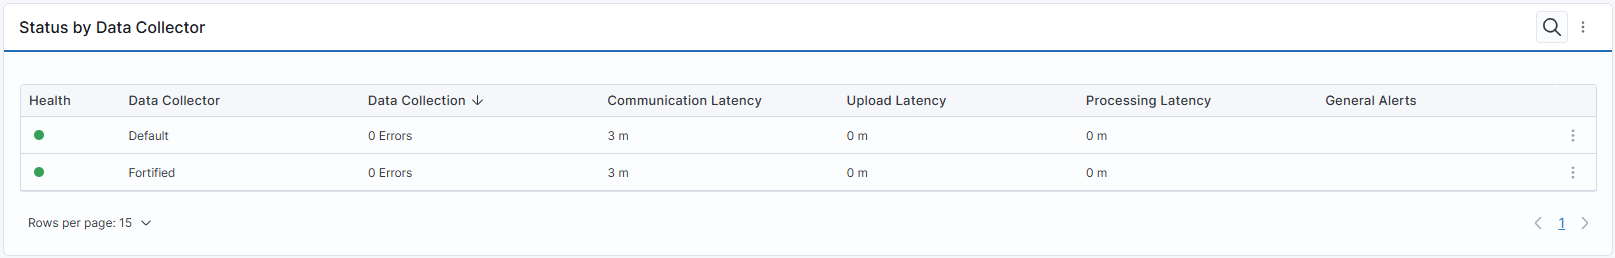
This card provides details about all configured and enabled Data Collectors within the client environment.
Features and Functions of the Table
-
Exclusion of Disabled Data Collectors: Disabled Data Collectors are not included in this list.
-
Pagination: If there are many enabled Data Collectors, the information may be spread across multiple pages, as indicated in the bottom right corner of the table.
-
Search Functionality: A Search icon (spyglass) is located in the upper right corner of the card, allowing you to quickly locate a specific Data Collector by entering part of its name.
-
Action Options: The action icon (three vertical dots) in the upper right corner of the table, next to the spyglass, provides the following options:
- View in Full Screen: Expand the data view to full screen.
- Export to Excel: Download the data in Excel format.
The Status by Data Collector table includes the following information:
-
Health: Displays the health status of the Collector environment, represented by a colored dot.
- Green: Indicates a healthy Data Collector that is collecting all expected data.
- Red: Indicates issues with the collection of some or all data, or problems uploading data to the Fortified WISdom Cloud API.
-
Data Collector: Displays the name of the Data Collector.
-
Data Collection: Shows the number of collection errors for the Data Collector.
-
Communication Latency: Displays any delays in communication from the collection service to the target resource.
-
Upload Latency: Indicates any delays in uploading data to the Fortified WISdom Cloud API.
-
Processing Latency: Shows any delays in processing the data uploaded to WISdom API.
Clicking on a Data Collector row that has an error count of 1 or more will open a flyout, providing detailed information about the error.
Collection Error Flyout
The Collection Error Flyout can be accessed by either clicking on the row of the Data Collector that has an error or by clicking the action icon (three vertical dots) at the end of the row and selecting View Details. Either method will cause the flyout to appear from the right side of the screen.
The flyout will display one row for each error associated with the selected Data Collector. Each row contains a table with the following information:
-
Expander Icon [>]: Clicking the expander icon opens the selected row to display the Resource Details related to the error.
-
Server: The name of the target associated with the error, which may be either an Instance or Host name.
-
Since: The date and time when the error first occurred.
-
Platform: The platform of the object that encountered the error, which may be either SQL Server or Windows Machine.
-
Error Type: The category of the error encountered.
-
Description: A brief overview of the error that occurred.
Resource Details
The expanded row displays additional information related to the selected error. The Resource Details section contains the following information:
-
Environment: The name of the Data Collector that encountered the error.
-
Instance or Host: The name of either the SQL instance or the Windows host, displayed based on which target encountered the error.
-
Platform: The platform of the object that encountered the error, which may be either SQL Server or Windows Machine.
-
Since: The date and time when the error first occurred.
-
Last Occurrence: The date and time when the error was last recorded.
-
Error Message Card: This card contains the error message, with a description provided below.
- Error Description: A detailed explanation of the error message displayed above.
-
Error Solution Card: This card contains information about potential solutions.
- Possible Solutions: Details on potential solutions to the encountered error.