Database Activity
- 30 Jan 2023
- 2 Minutes to read
- Contributors

- Print
- DarkLight
- PDF
Database Activity
- Updated on 30 Jan 2023
- 2 Minutes to read
- Contributors
- Print
- DarkLight
- PDF
Article summary
Did you find this summary helpful?
Thank you for your feedback
The histogram provides an aggregated distribution of data over the defined time range. The number of running processes and blocking events that fall within the specified range of time are displayed. Additionally, filters provide ways to view the SQL Statements being run at the time of collection and further examine any performance issues in the underlying system code.
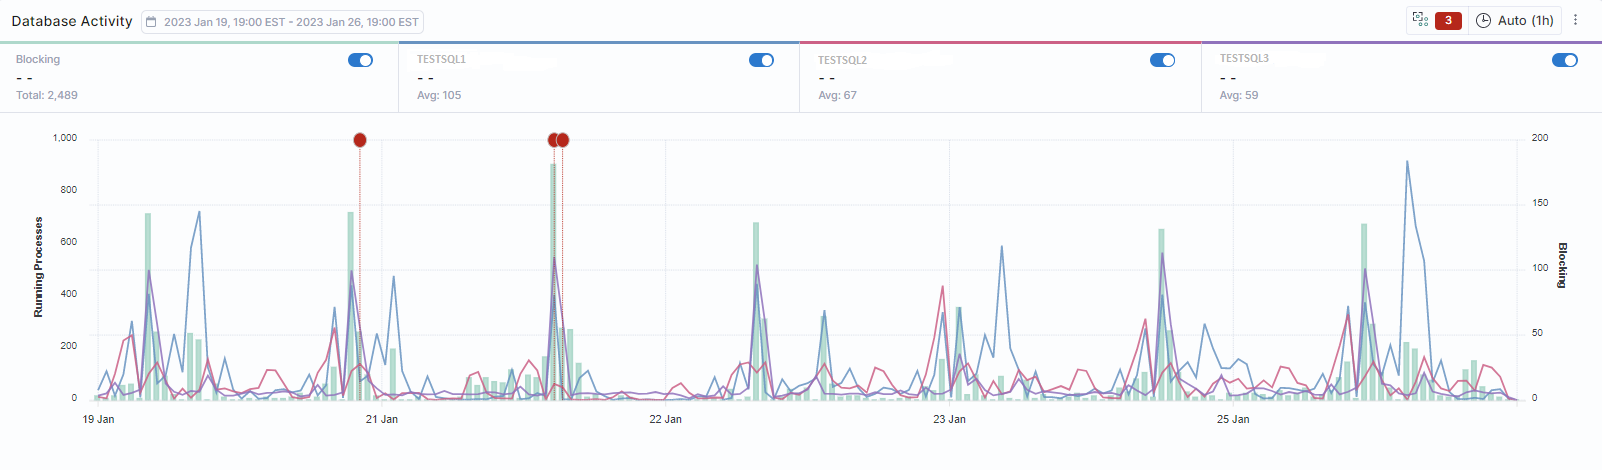
The color-coded stacked lines plot the performance trends on a server level for the top three (3) instances within the selected date range. To examine the performance of individual Instances, the visual display can be changed to further identify which processes are putting computing or memory pressure on the system, as follows:
Use the calendar widget to change the date range (default is last seven (7) days). The selected range is displayed on the card tool bar.
Use the time widget to change the time interval displayed (Auto is one (1) hour).
Use the slide toggles to filter the display by either blocking events and/or top instance(s).
Use the Environment, Instance, Database, Login Name, Program, Wait Type, Weekday, and Time of Day drop-down Filters to change the visualization. Depending on the filter(s) selected, the histogram will display the top three instances for that criteria.
To highlight data points, hover the cursor over the stacked, color-coded lines. The marker pop-up will display the number of running process and blocking events by date and time for the selected Instance(s). These values are also displayed below the slide toggles along with totals and averages based on percentage contribution.
To concentrate the display on a specific time range, using the left button, drag the cursor over the display to select the block of time. The histogram will display only that refinement.
Viewing Anomalies:
Hover the cursor over the Anomalies button in the card tool bar. If anomalies exist, the button will be enabled and display the number of anomalies occurring within the specified date range. Click the button to view the Query Results Count Anomalies pop-up.
- This pop-up displays when the anomaly Started and Ended, the Instance and Database where it occurred, the Actual and Typical counts and a description of the deviation from the expected value.
- To view an anomaly in the dashboard display, click the 3-Dot icon for that row and click View Anomaly. The histogram will now display the instance with the anomaly highlighted for further investigation.
The data displayed in the Database Activities and Top Events cards can also be further focused using Slicers.
Was this article helpful?